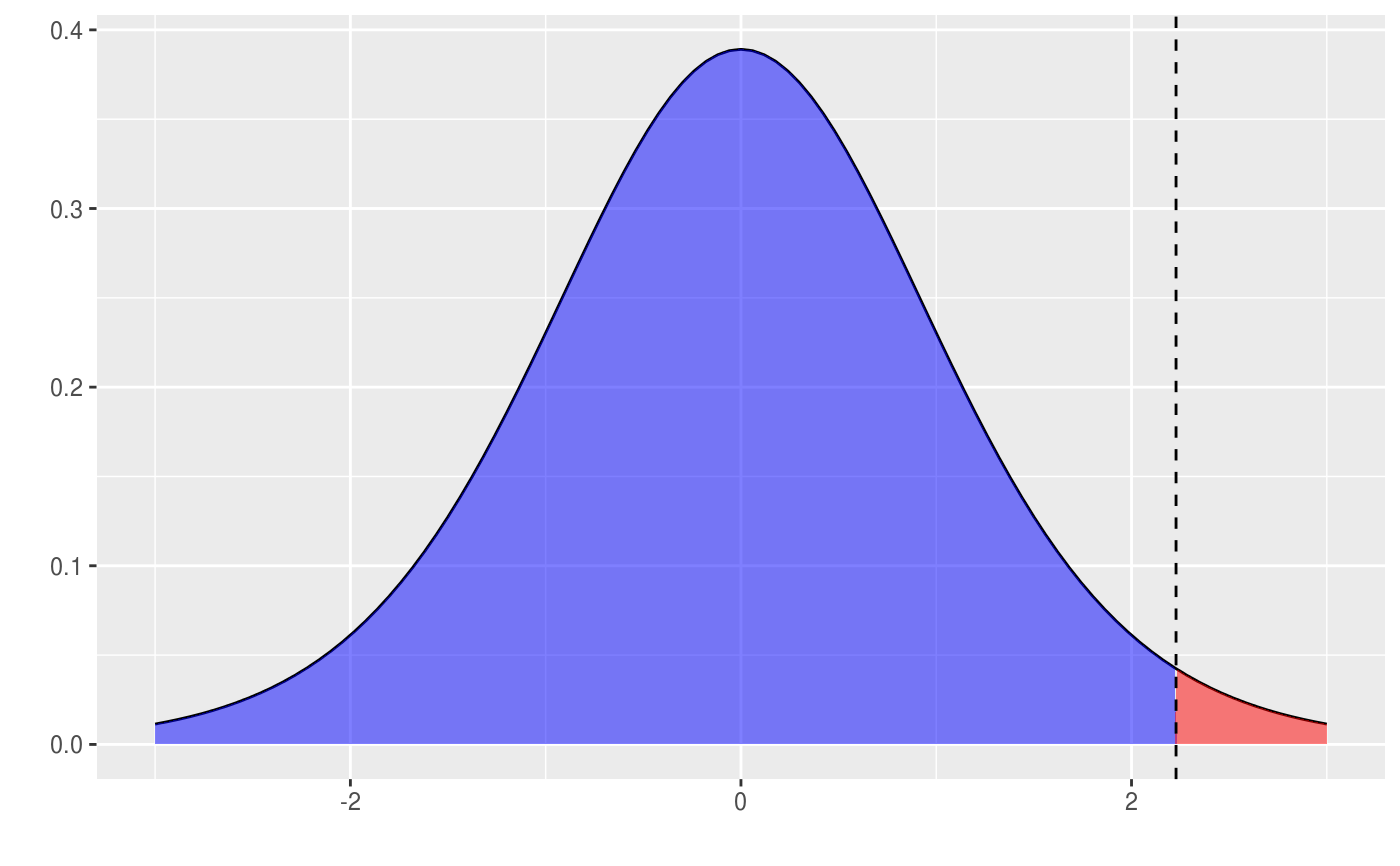
Plot method for the probability calculator (t-distribution)
Source:R/prob_calc.R
plot.prob_tdist.RdPlot method for the probability calculator (t-distribution)
# S3 method for prob_tdist
plot(x, type = "values", ...)
Arguments
| x | Return value from |
|---|---|
| type | Probabilities ("probs") or values ("values") |
| ... | further arguments passed to or from other methods |
Details
See https://radiant-rstats.github.io/docs/basics/prob_calc.html for an example in Radiant
See also
prob_tdist to calculate results
summary.prob_tdist to summarize results