Plot method for the conjoint function
# S3 method for conjoint
plot(x, plots = "pw", show = "",
  scale_plot = FALSE, shiny = FALSE, custom = FALSE, ...)
Arguments
| x | Return value from |
|---|---|
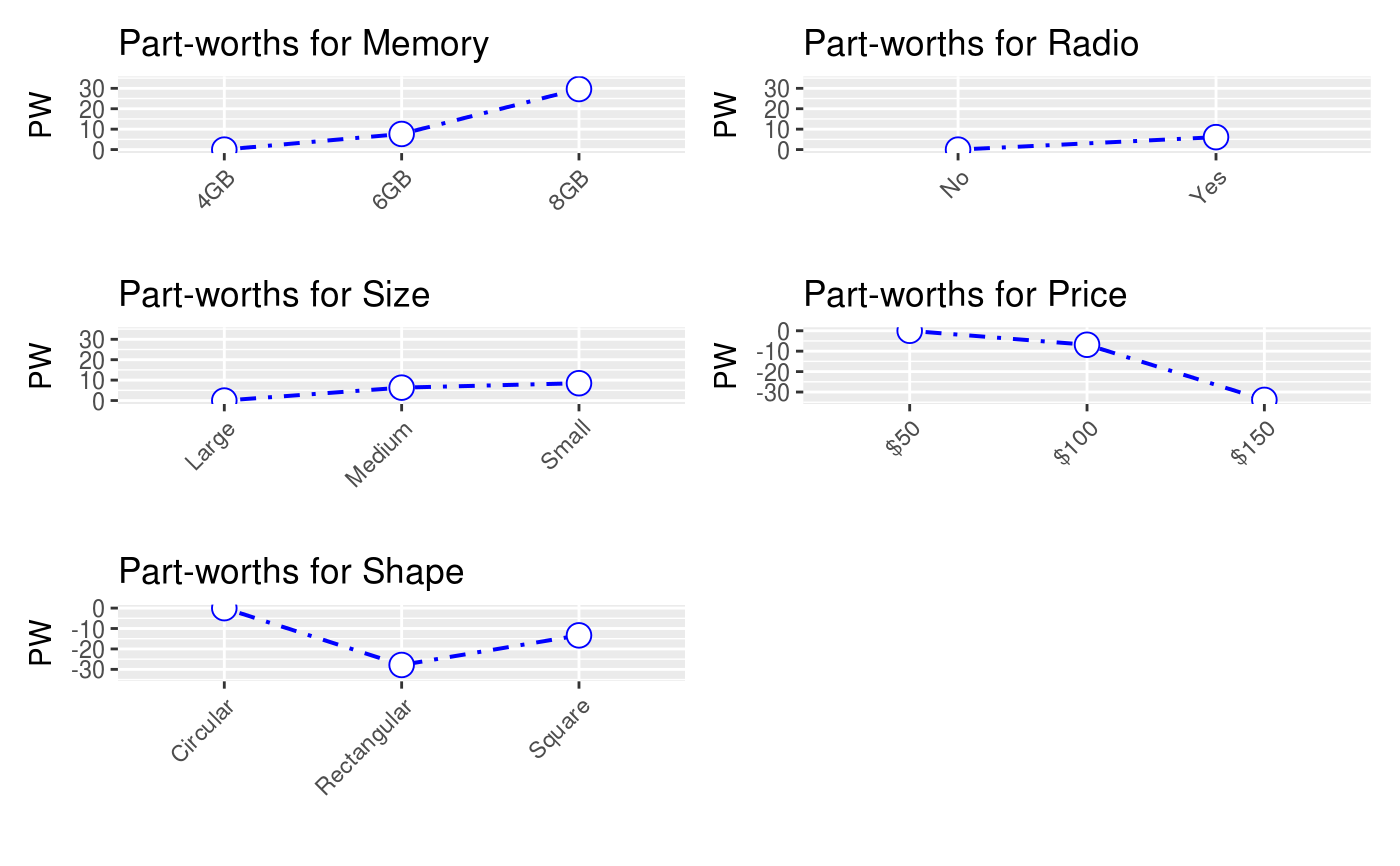
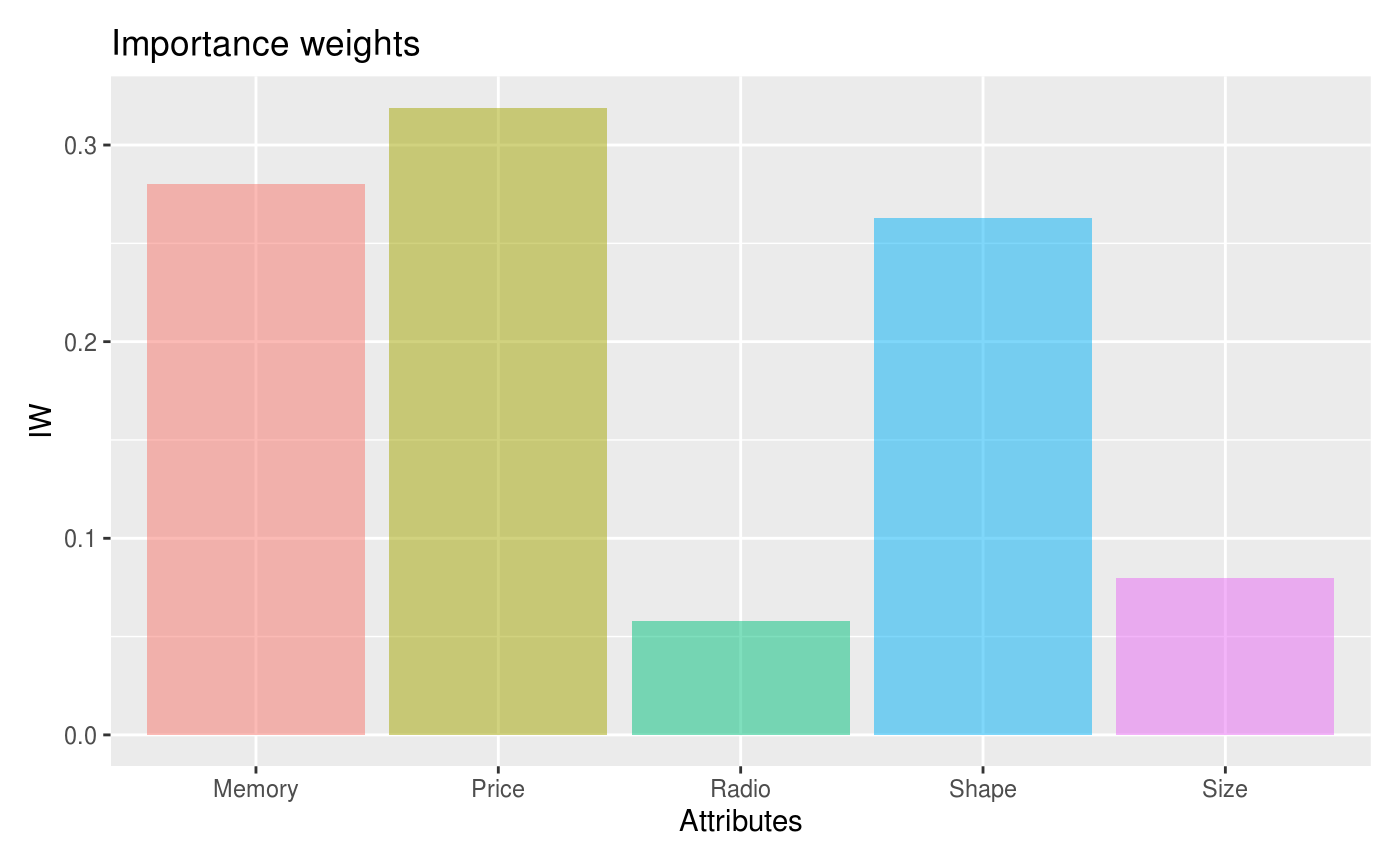
| plots | Show either the part-worth ("pw") or importance-weights ("iw") plot |
| show | Level in by variable to analyze (e.g., a specific respondent) |
| scale_plot | Scale the axes of the part-worth plots to the same range |
| shiny | Did the function call originate inside a shiny app |
| custom | Logical (TRUE, FALSE) to indicate if ggplot object (or list of ggplot objects) should be returned. This option can be used to customize plots (e.g., add a title, change x and y labels, etc.). See examples and http://docs.ggplot2.org for options. |
| ... | further arguments passed to or from other methods |
Details
See https://radiant-rstats.github.io/docs/multivariate/conjoint.html for an example in Radiant
See also
conjoint to generate results
summary.conjoint to summarize results