Plot method for the prmap function
# S3 method for prmap
plot(x, plots = "", scaling = 2, fontsz = 5,
  seed = 1234, shiny = FALSE, custom = FALSE, ...)
Arguments
| x | Return value from |
|---|---|
| plots | Components to include in the plot ("brand", "attr"). If data on preferences is available use "pref" to add preference arrows to the plot |
| scaling | Arrow scaling in the brand map |
| fontsz | Font size to use in plots |
| seed | Random seed |
| shiny | Did the function call originate inside a shiny app |
| custom | Logical (TRUE, FALSE) to indicate if ggplot object (or list of ggplot objects) should be returned. This option can be used to customize plots (e.g., add a title, change x and y labels, etc.). See examples and http://docs.ggplot2.org for options. |
| ... | further arguments passed to or from other methods |
Details
See https://radiant-rstats.github.io/docs/multivariate/prmap.html for an example in Radiant
See also
prmap to calculate results
summary.prmap to plot results
Examples
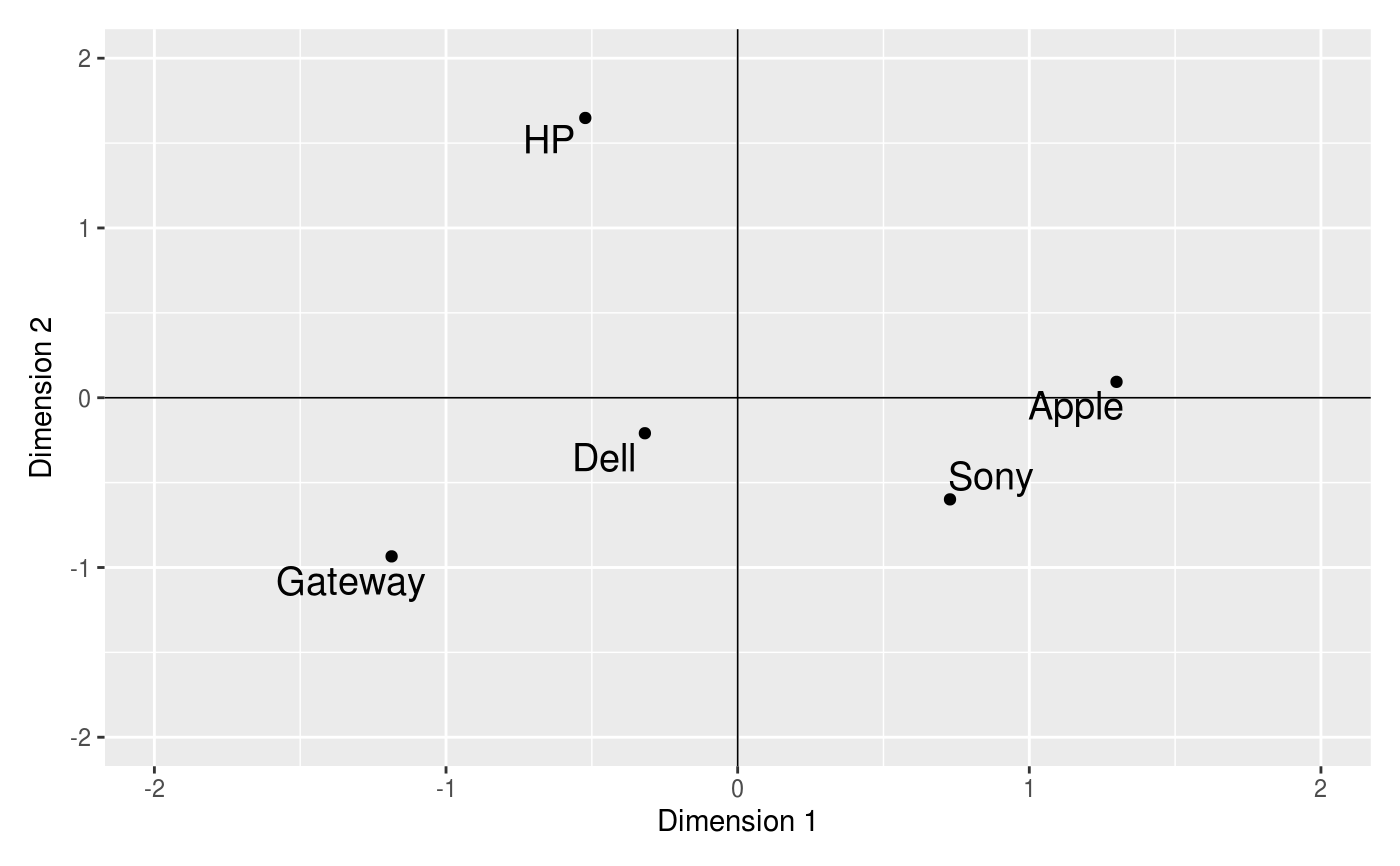
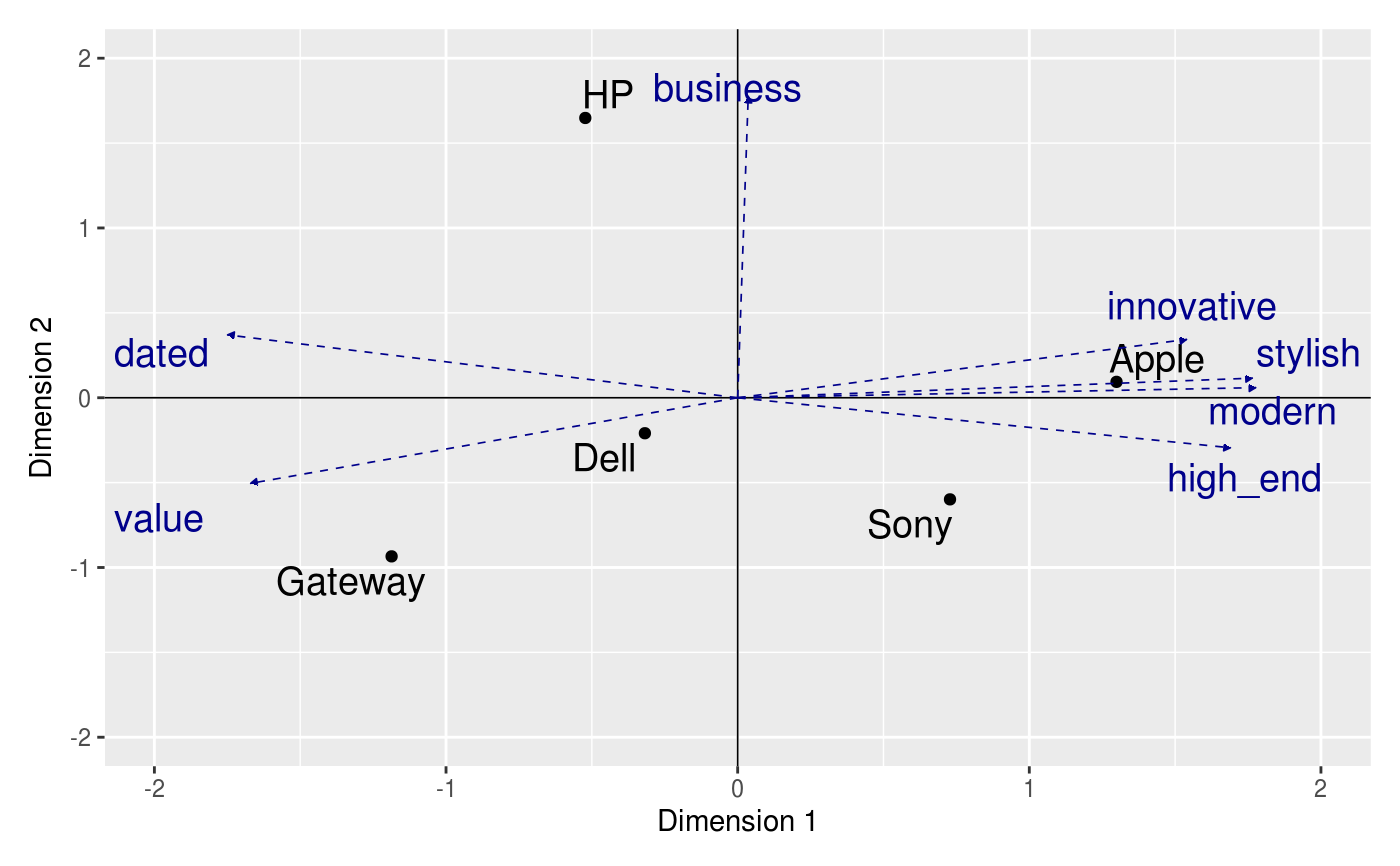
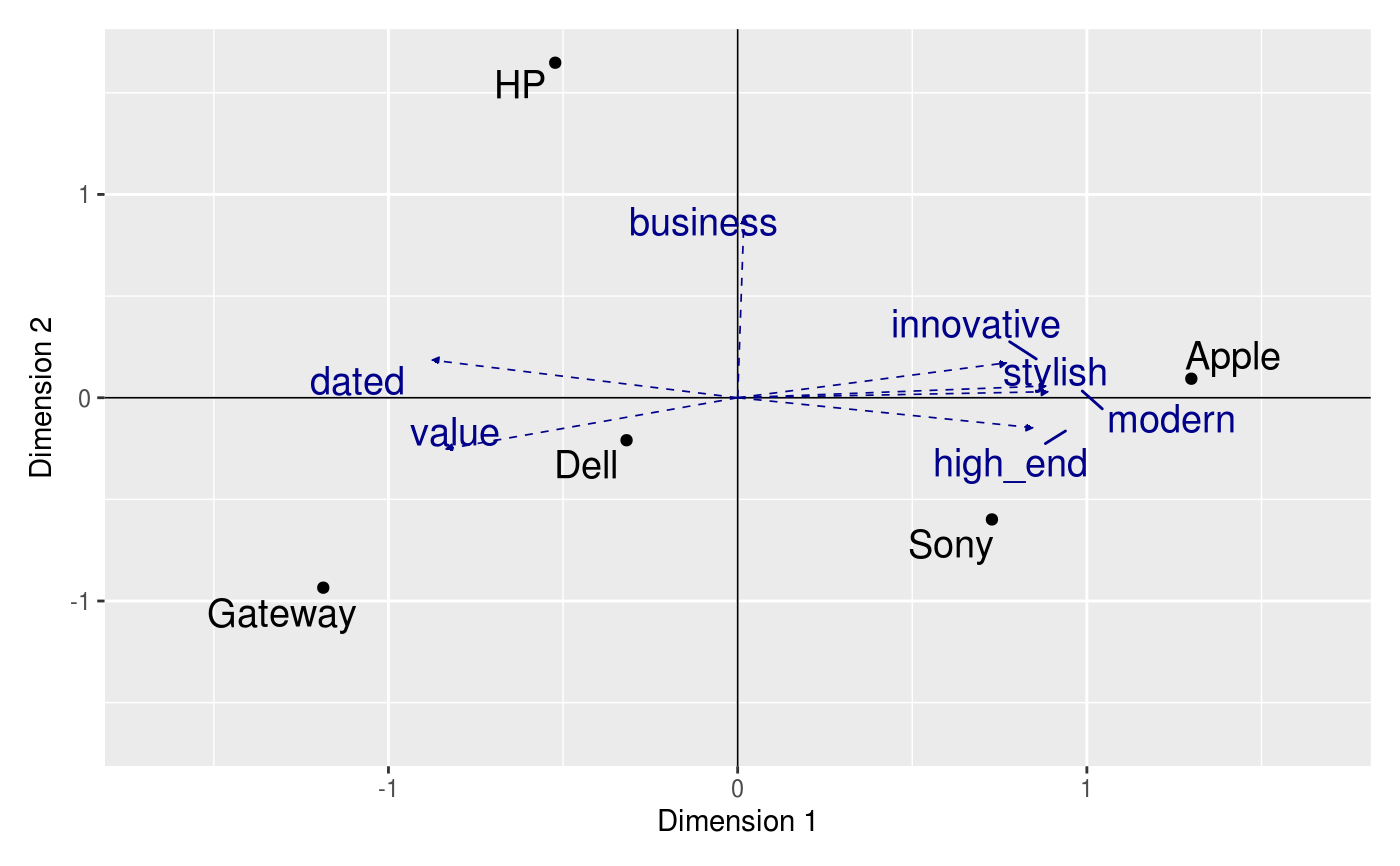
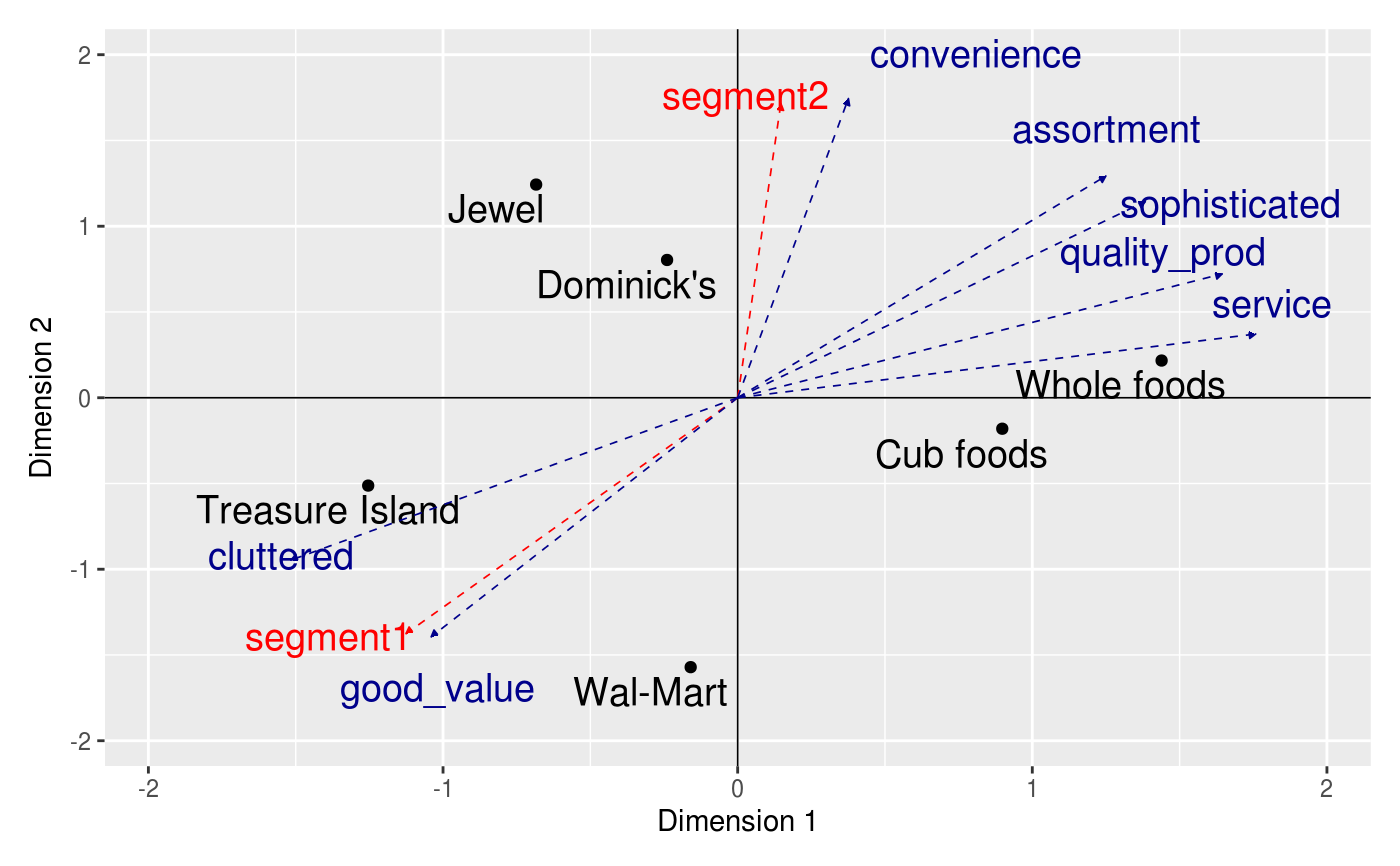
result <- prmap(computer, brand = "brand", attr = "high_end:business") plot(result, plots = "brand")prmap( retailers, brand = "retailer", attr = "good_value:cluttered", pref = c("segment1", "segment2") ) %>% plot(plots = c("brand", "attr", "pref"))