Plot method for the cross_tabs function
# S3 method for cross_tabs
plot(x, check = "", shiny = FALSE, custom = FALSE, ...)
Arguments
| x | Return value from |
|---|---|
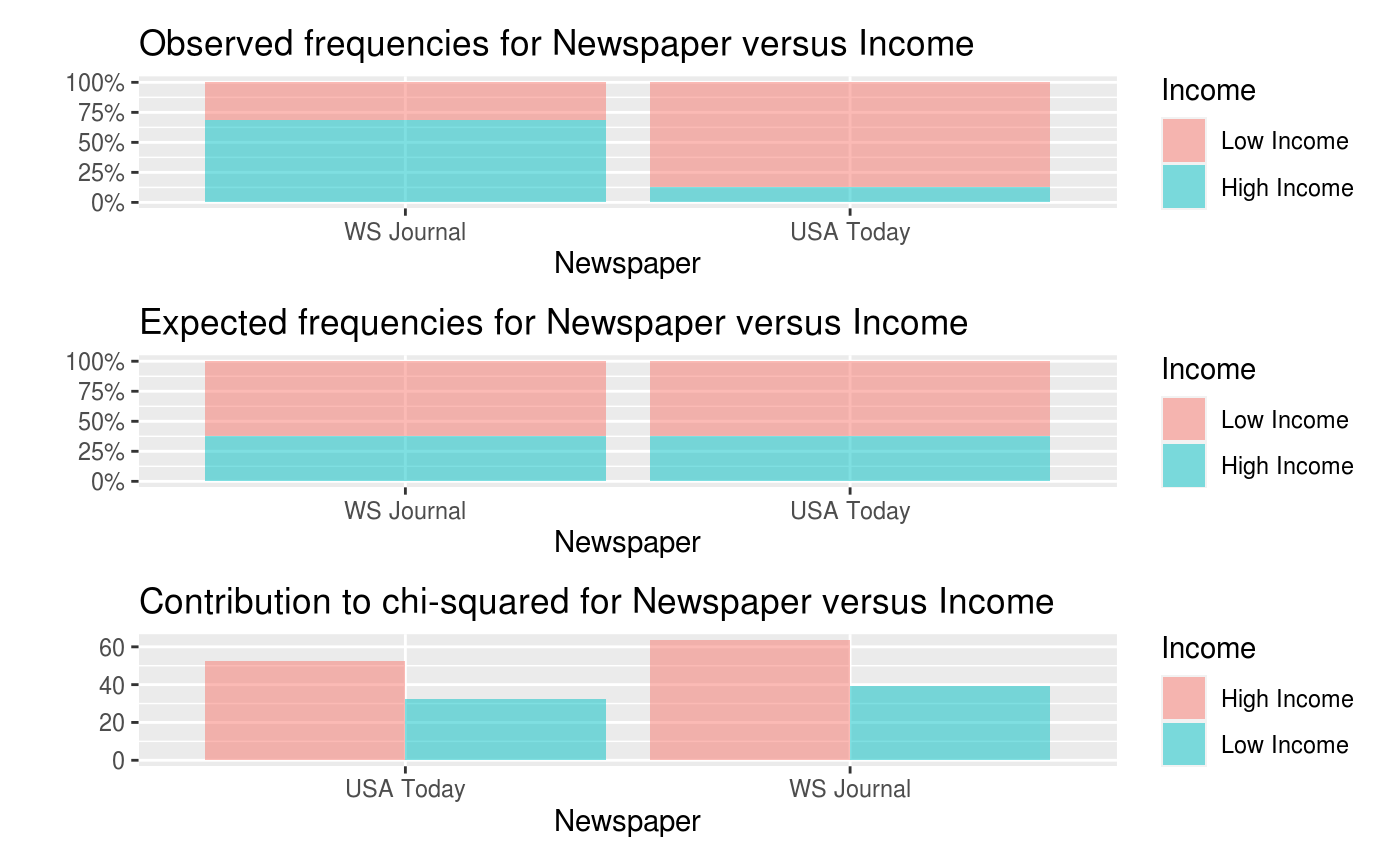
| check | Show plots for variables var1 and var2. "observed" for the observed frequencies table, "expected" for the expected frequencies table (i.e., frequencies that would be expected if the null hypothesis holds), "chi_sq" for the contribution to the overall chi-squared statistic for each cell (i.e., (o - e)^2 / e), "dev_std" for the standardized differences between the observed and expected frequencies (i.e., (o - e) / sqrt(e)), and "row_perc", "col_perc", and "perc" for row, column, and table percentages respectively |
| shiny | Did the function call originate inside a shiny app |
| custom | Logical (TRUE, FALSE) to indicate if ggplot object (or list of ggplot objects) should be returned. This option can be used to customize plots (e.g., add a title, change x and y labels, etc.). See examples and http://docs.ggplot2.org for options. |
| ... | further arguments passed to or from other methods |
Details
See https://radiant-rstats.github.io/docs/basics/cross_tabs.html for an example in Radiant
See also
cross_tabs to calculate results
summary.cross_tabs to summarize results
Examples
result <- cross_tabs(newspaper, "Income", "Newspaper")
plot(result, check = c("observed","expected","chi_sq"))