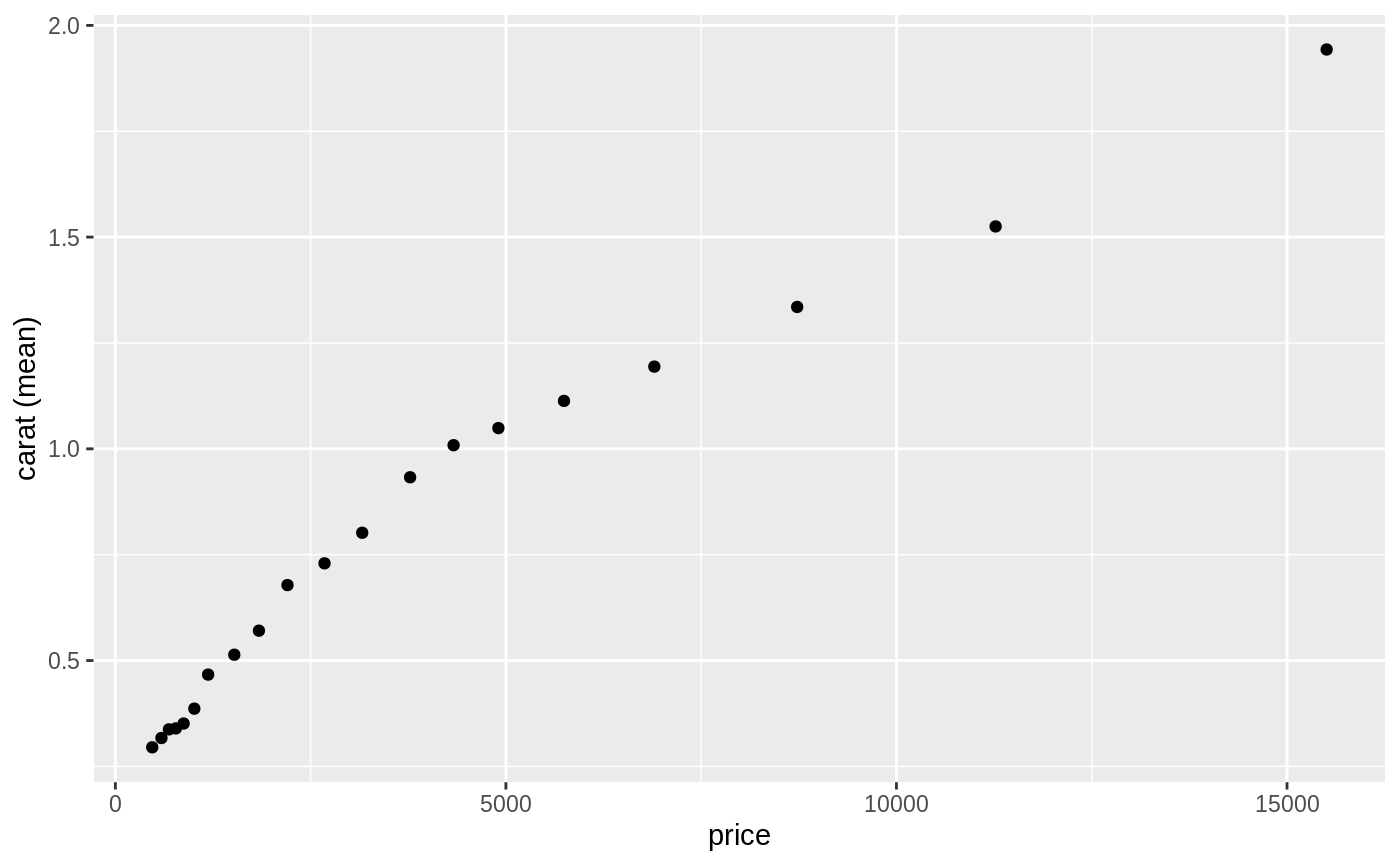
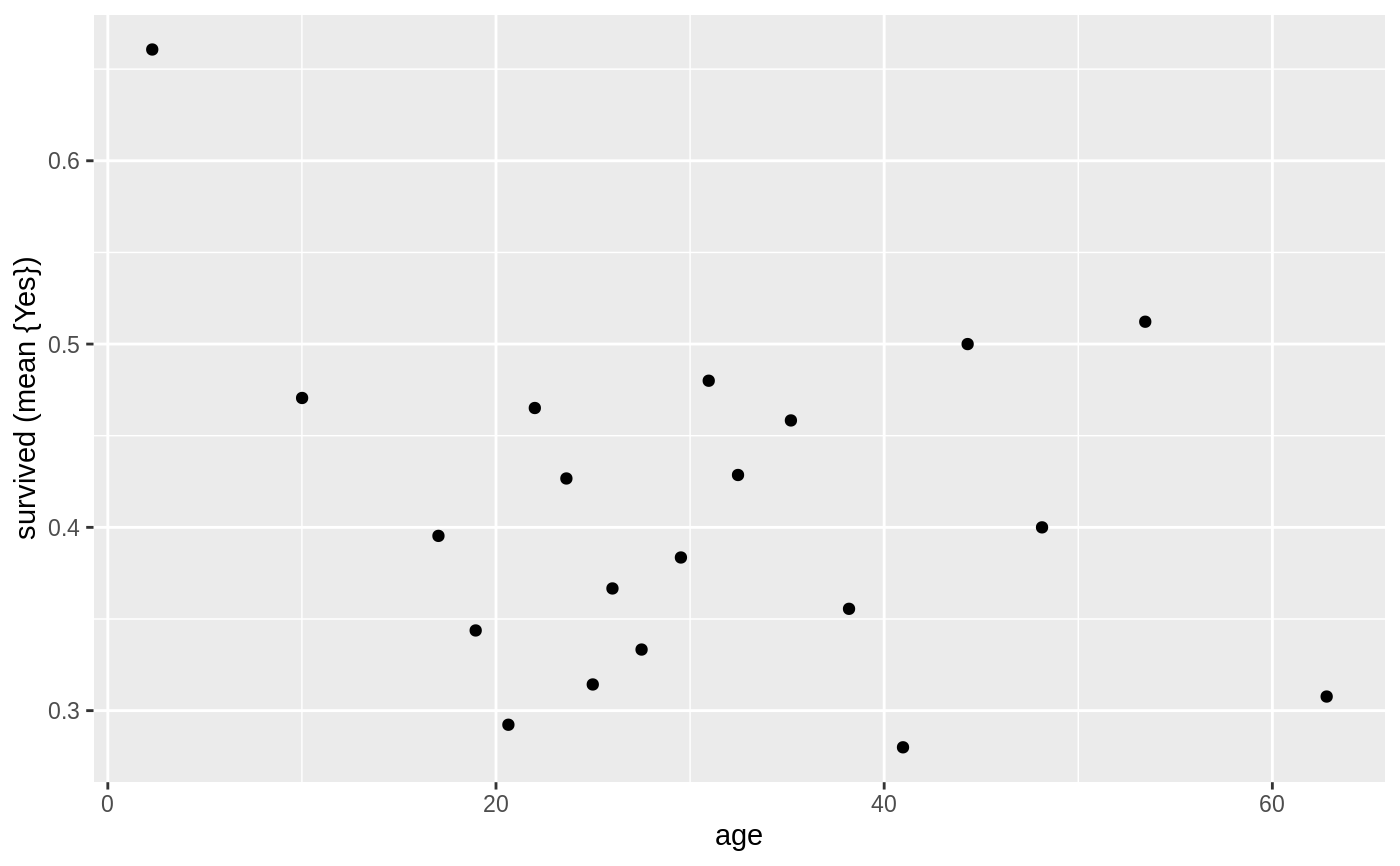
Create a qscatter plot similar to Stata
qscatter(dataset, xvar, yvar, lev = "", fun = "mean", bins = 20)
Arguments
| dataset | Data to plot (data.frame or tibble) |
|---|---|
| xvar | Character indicating the variable to display along the X-axis of the plot |
| yvar | Character indicating the variable to display along the Y-axis of the plot |
| lev | Level in yvar to use if yvar is of type character of factor. If lev is empty then the first level is used |
| fun | Summary measure to apply to both the x and y variable |
| bins | Number of bins to use |
Examples
qscatter(diamonds, "price", "carat")qscatter(titanic, "age", "survived")