Plot method for the crtree function
# S3 method for crtree
plot(
  x,
  plots = "tree",
  orient = "LR",
  width = "900px",
  labs = TRUE,
  nrobs = Inf,
  dec = 2,
  shiny = FALSE,
  custom = FALSE,
  ...
)
Arguments
| x | Return value from |
|---|---|
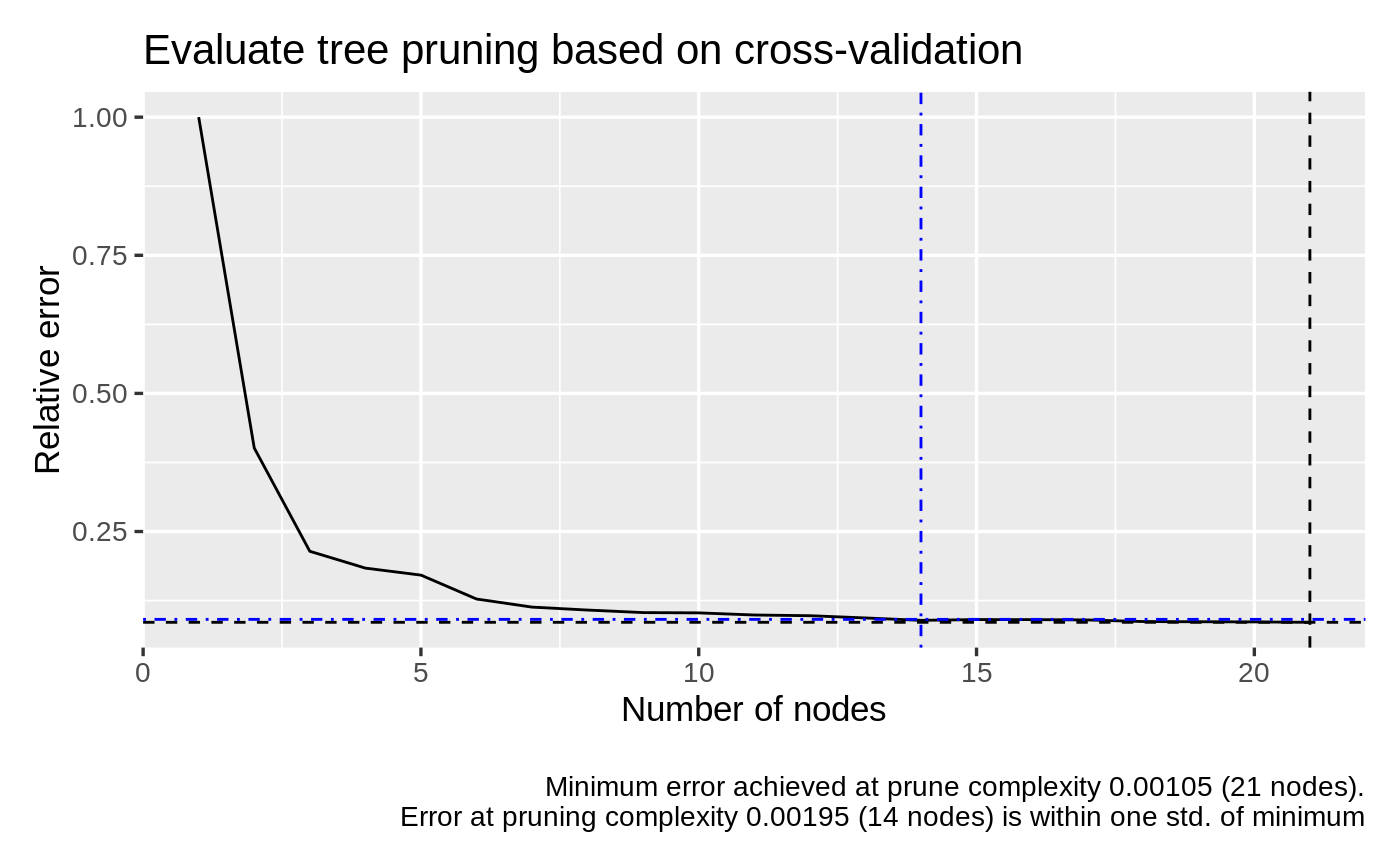
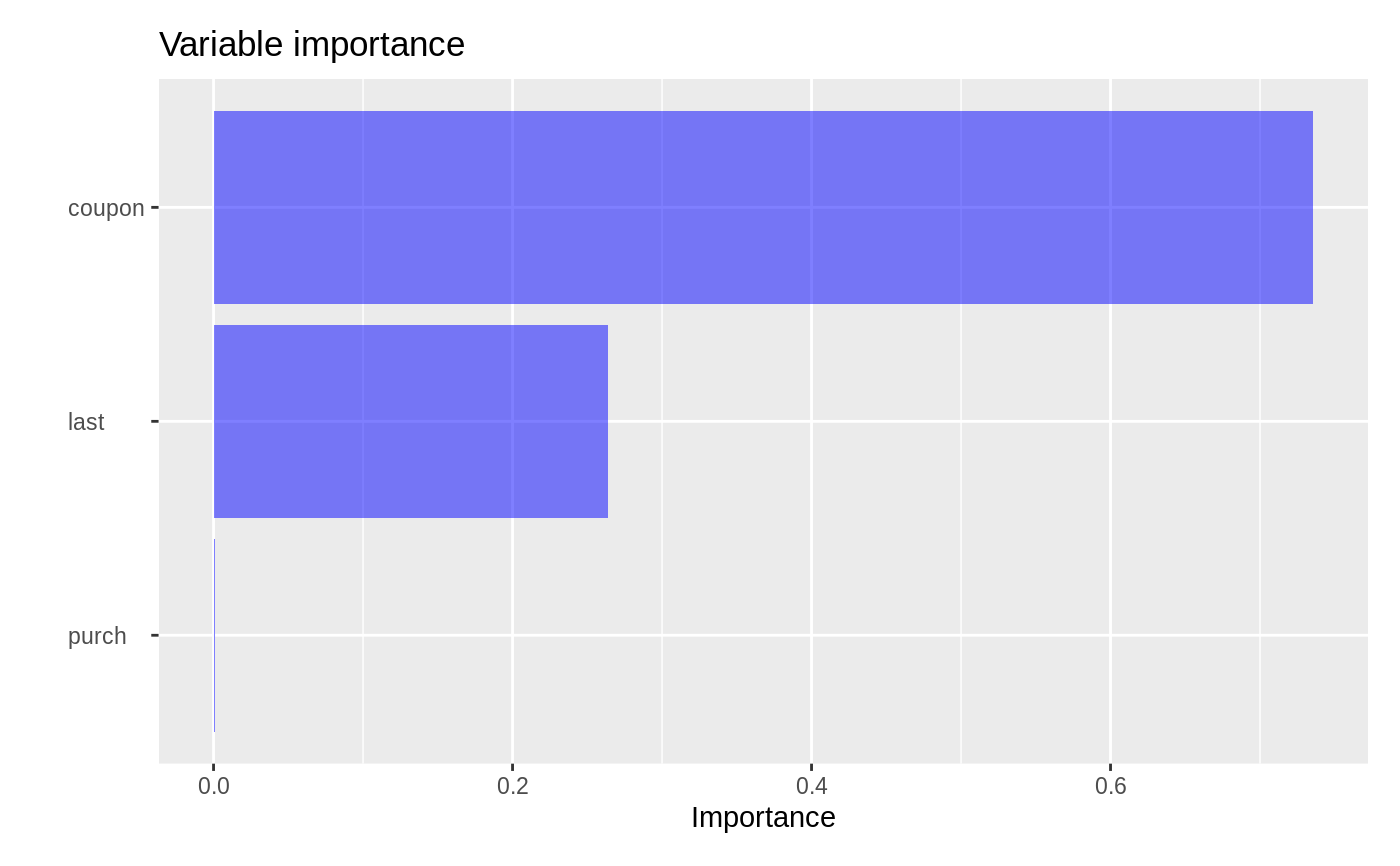
| plots | Plots to produce for the specified rpart tree. "tree" shows a tree diagram. "prune" shows a line graph to evaluate appropriate tree pruning. "imp" shows a variable importance plot |
| orient | Plot orientation for tree: LR for vertical and TD for horizontal |
| width | Plot width in pixels for tree (default is "900px") |
| labs | Use factor labels in plot (TRUE) or revert to default letters used by tree (FALSE) |
| nrobs | Number of data points to show in dashboard scatter plots (-1 for all) |
| dec | Decimal places to round results to |
| shiny | Did the function call originate inside a shiny app |
| custom | Logical (TRUE, FALSE) to indicate if ggplot object (or list of ggplot objects) should be returned. This option can be used to customize plots (e.g., add a title, change x and y labels, etc.). See examples and https://ggplot2.tidyverse.org for options. |
| ... | further arguments passed to or from other methods |
Details
See https://radiant-rstats.github.io/docs/model/crtree.html for an example in Radiant. The standard tree plot used by by the rpart package can be generated by plot.rpart(result$model). See plot.rpart for additional details.
See also
crtree to generate results
summary.crtree to summarize results
predict.crtree for prediction
Examples
result <- crtree(titanic, "survived", c("pclass", "sex"), lev = "Yes") plot(result) result <- crtree(diamonds, "price", c("carat", "clarity", "cut")) plot(result, plots = "prune")