Plot method for the nb function
# S3 method for nb
plot(x, plots = "correlations", lev = "All levels", nrobs = 1000, ...)
Arguments
| x | Return value from |
|---|---|
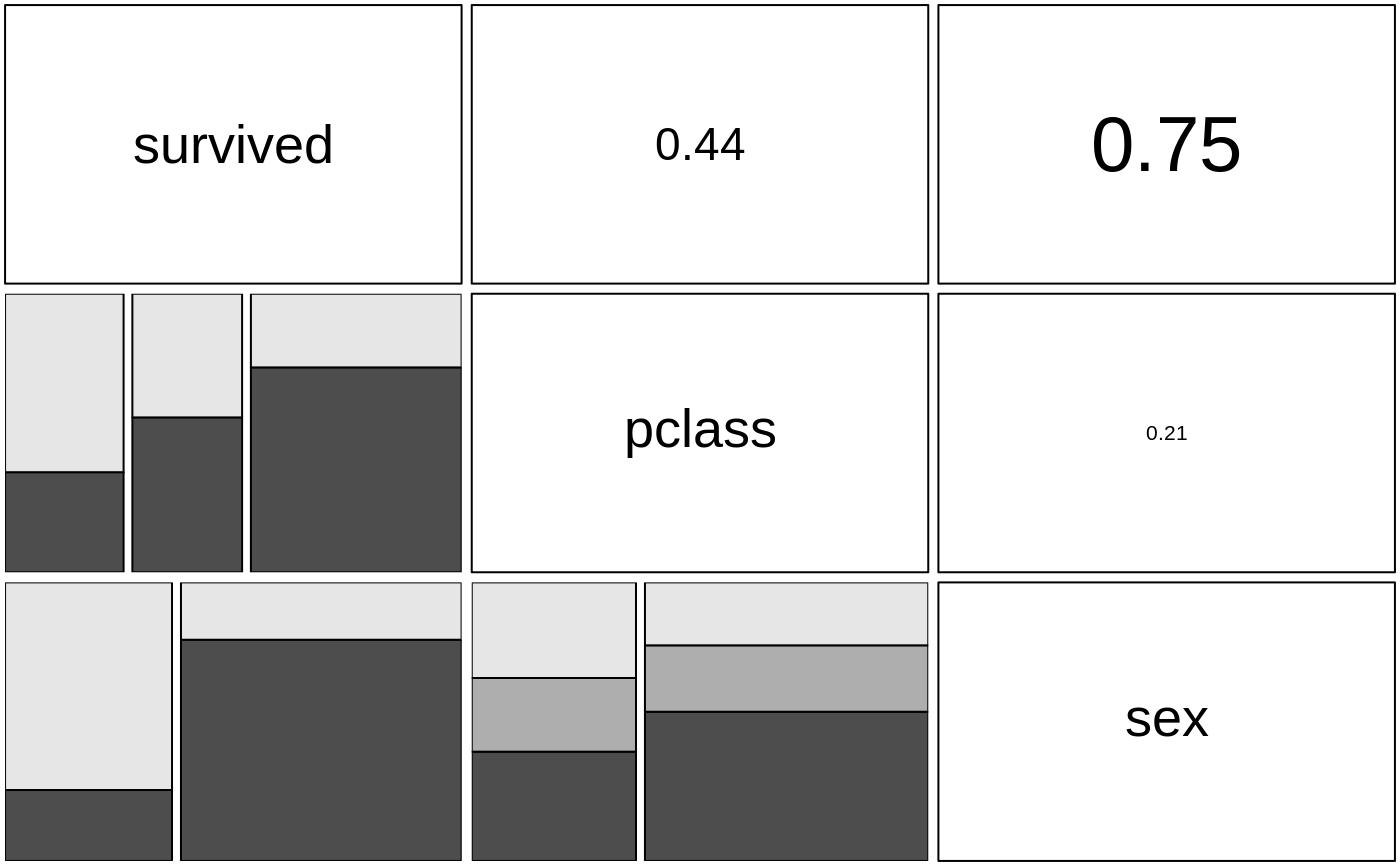
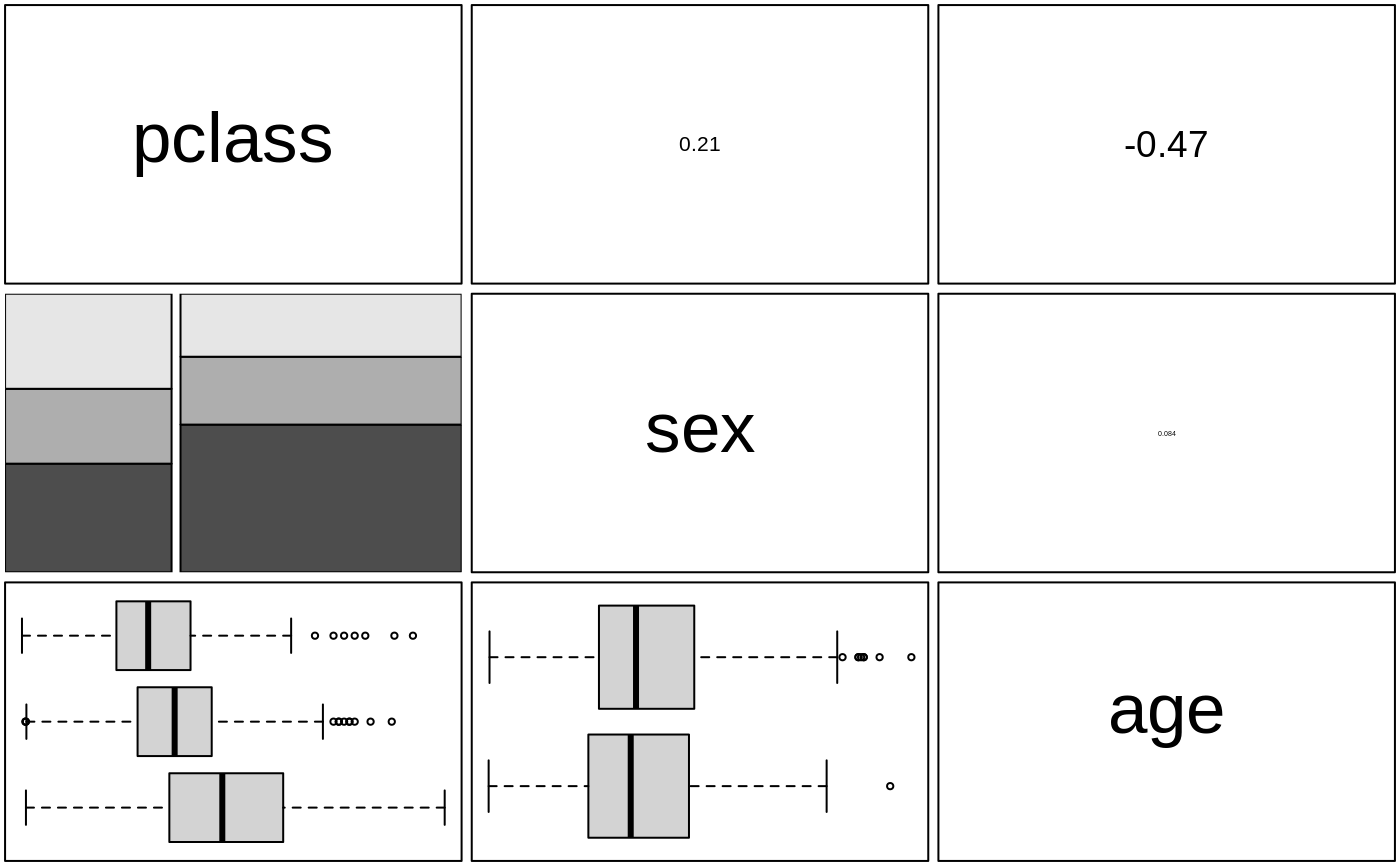
| plots | Plots to produce for the specified model. Use "" to avoid showing any plots. Use "vimp" for variable importance or "correlations" to examine conditional independence |
| lev | The level(s) in the response variable used as the basis for plots (defaults to "All levels") |
| nrobs | Number of data points to show in scatter plots (-1 for all) |
| ... | further arguments passed to or from other methods |
Details
See https://radiant-rstats.github.io/docs/model/nb.html for an example in Radiant
See also
nb to generate results
summary.nb to summarize results
predict.nb for prediction