Plot method for the nn function
# S3 method for nn
plot(
  x,
  plots = "garson",
  size = 12,
  pad_x = 0.9,
  nrobs = -1,
  shiny = FALSE,
  custom = FALSE,
  ...
)
Arguments
| x | Return value from |
|---|---|
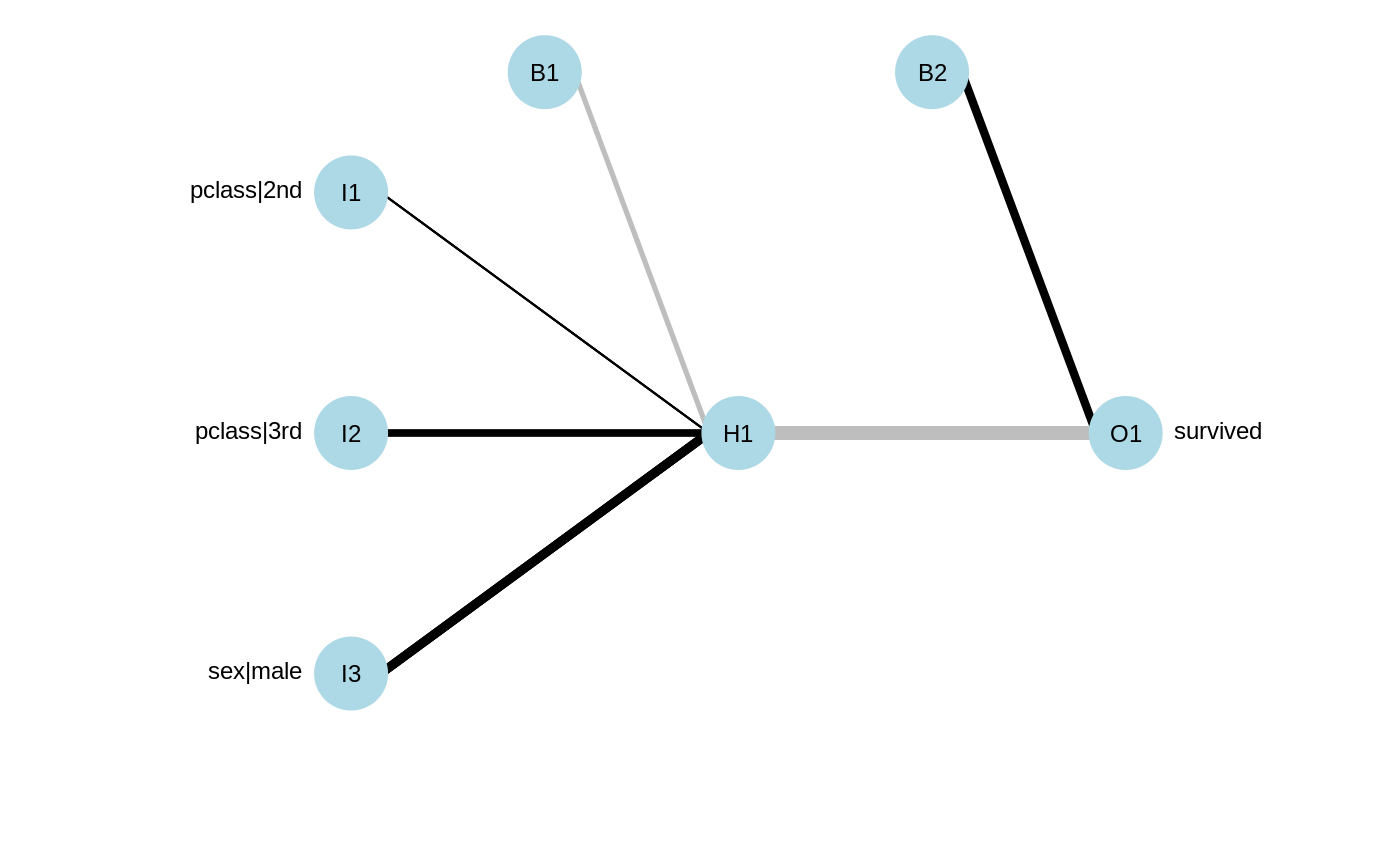
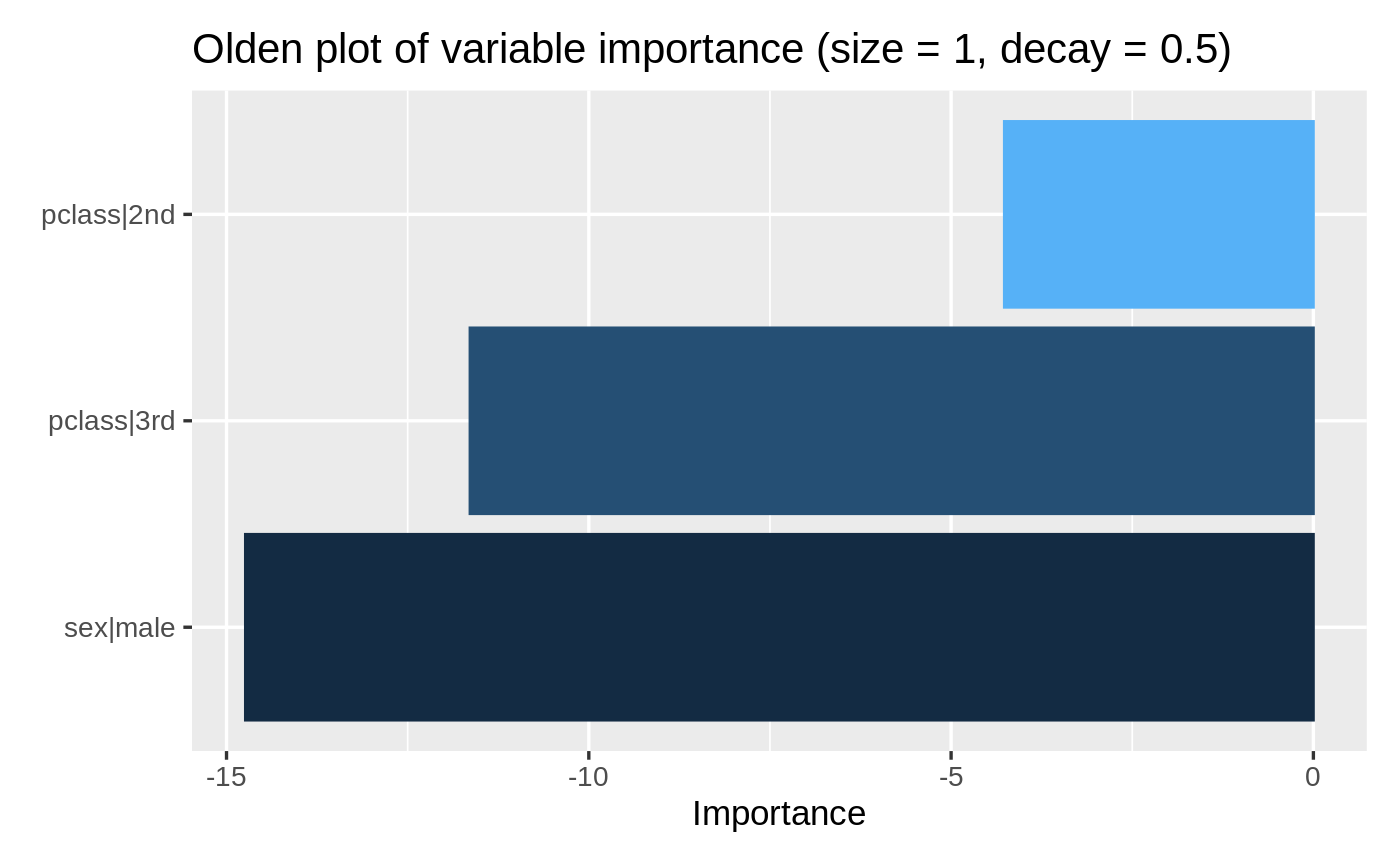
| plots | Plots to produce for the specified Neural Network model. Use "" to avoid showing any plots (default). Options are "olden" or "garson" for importance plots, or "net" to depict the network structure |
| size | Font size used |
| pad_x | Padding for explanatory variable labels in the network plot. Default value is 0.9, smaller numbers (e.g., 0.5) increase the amount of padding |
| nrobs | Number of data points to show in dashboard scatter plots (-1 for all) |
| shiny | Did the function call originate inside a shiny app |
| custom | Logical (TRUE, FALSE) to indicate if ggplot object (or list of ggplot objects) should be returned. This option can be used to customize plots (e.g., add a title, change x and y labels, etc.). See examples and https://ggplot2.tidyverse.org for options. |
| ... | further arguments passed to or from other methods |
Details
See https://radiant-rstats.github.io/docs/model/nn.html for an example in Radiant
See also
nn to generate results
summary.nn to summarize results
predict.nn for prediction