Plot method for the simulater function
# S3 method for simulater
plot(x, bins = 20, shiny = FALSE, custom = FALSE, ...)
Arguments
| x | Return value from |
|---|---|
| bins | Number of bins used for histograms (1 - 50) |
| shiny | Did the function call originate inside a shiny app |
| custom | Logical (TRUE, FALSE) to indicate if ggplot object (or list of ggplot objects) should be returned. This option can be used to customize plots (e.g., add a title, change x and y labels, etc.). See examples and https://ggplot2.tidyverse.org for options. |
| ... | further arguments passed to or from other methods |
Details
See https://radiant-rstats.github.io/docs/model/simulater for an example in Radiant
See also
simulater to generate the result
summary.simulater to summarize results
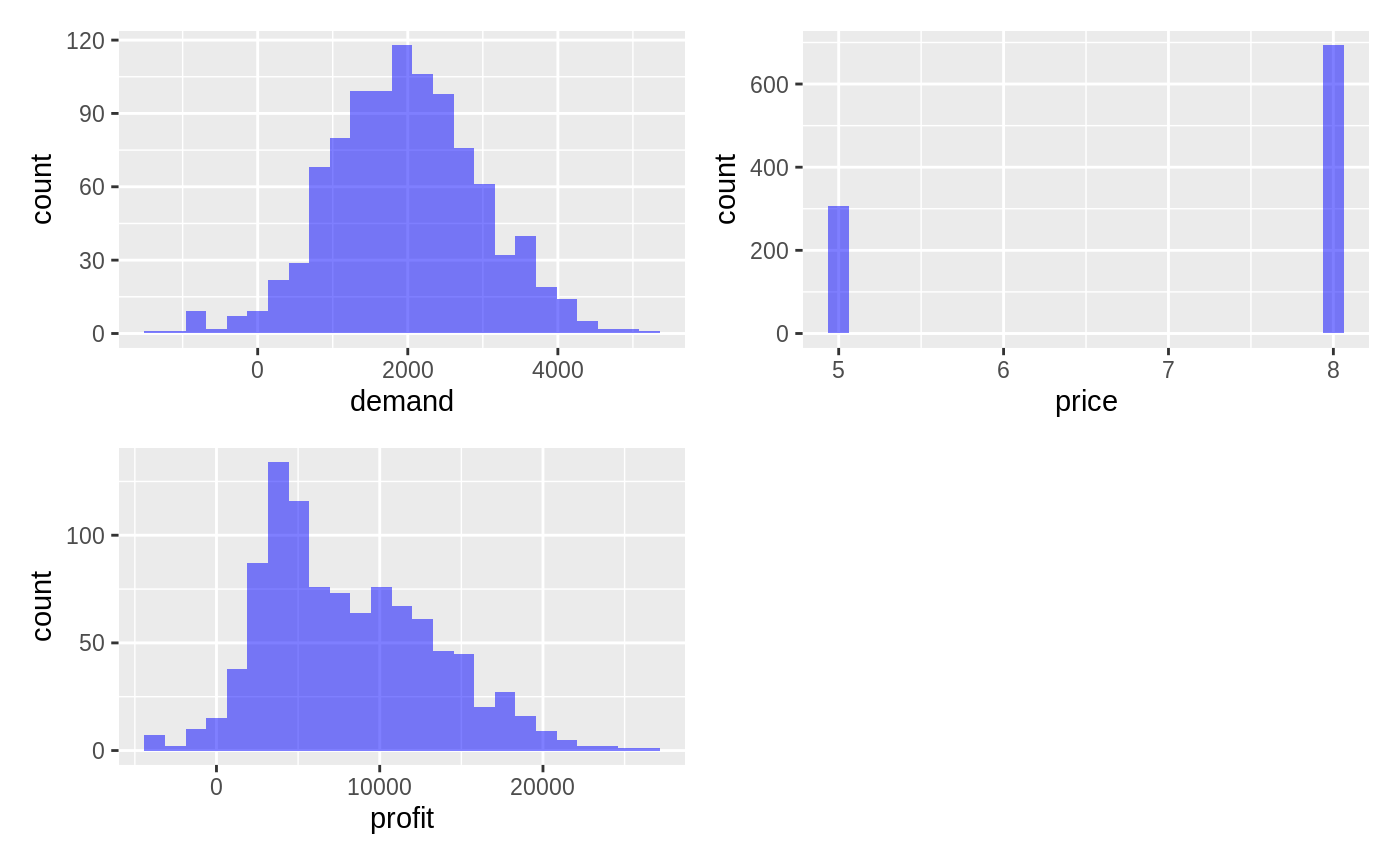
Examples
simdat <- simulater(
  const = "cost 3",
  norm = "demand 2000 1000",
  discrete = "price 5 8 .3 .7",
  form = "profit = demand * (price - cost)",
  seed = 1234
)
plot(simdat, bins = 25)