Plot method for the hclus function
# S3 method for hclus
plot(x, plots = c("scree", "change"), cutoff = 0.05,
  shiny = FALSE, custom = FALSE, ...)
Arguments
| x | Return value from |
|---|---|
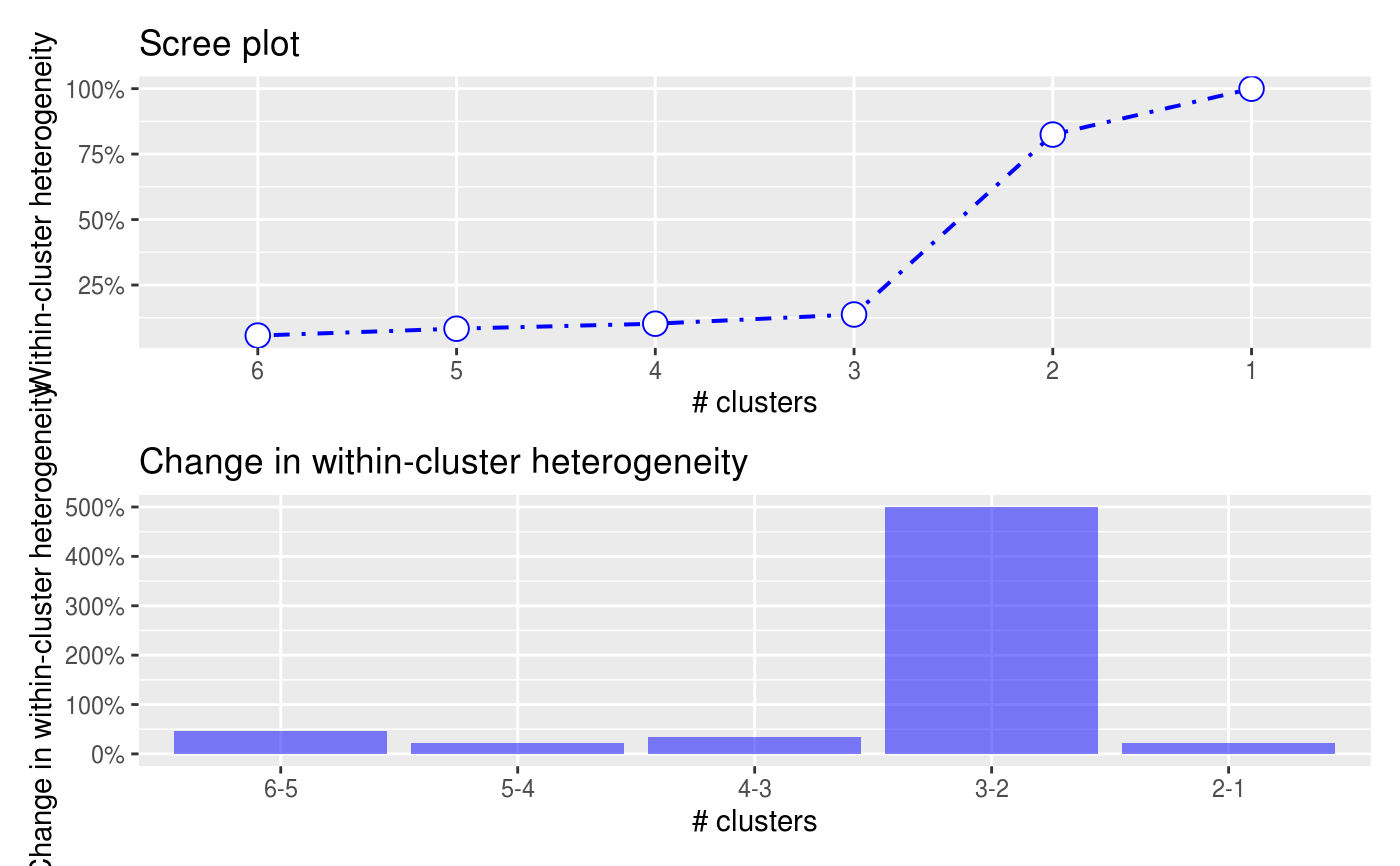
| plots | Plots to return. "change" shows the percentage change in within-cluster heterogeneity as respondents are grouped into different number of clusters, "dendro" shows the dendrogram, "scree" shows a scree plot of within-cluster heterogeneity |
| cutoff | For large datasets plots can take time to render and become hard to interpret. By selection a cutoff point (e.g., 0.05 percent) the initial steps in hierarchical cluster analysis are removed from the plot |
| shiny | Did the function call originate inside a shiny app |
| custom | Logical (TRUE, FALSE) to indicate if ggplot object (or list of ggplot objects) should be returned. This option can be used to customize plots (e.g., add a title, change x and y labels, etc.). See examples and http://docs.ggplot2.org for options. |
| ... | further arguments passed to or from other methods |
Details
See https://radiant-rstats.github.io/docs/multivariate/hclus.html for an example in Radiant
See also
hclus to generate results
summary.hclus to summarize results
Examples
result <- hclus(shopping, vars = c("v1:v6")) plot(result, plots = c("change", "scree"), cutoff = .05)