Plot method for the pre_factor function
# S3 method for pre_factor
plot(x, plots = c("scree", "change"),
  cutoff = 0.2, shiny = FALSE, custom = FALSE, ...)
Arguments
| x | Return value from |
|---|---|
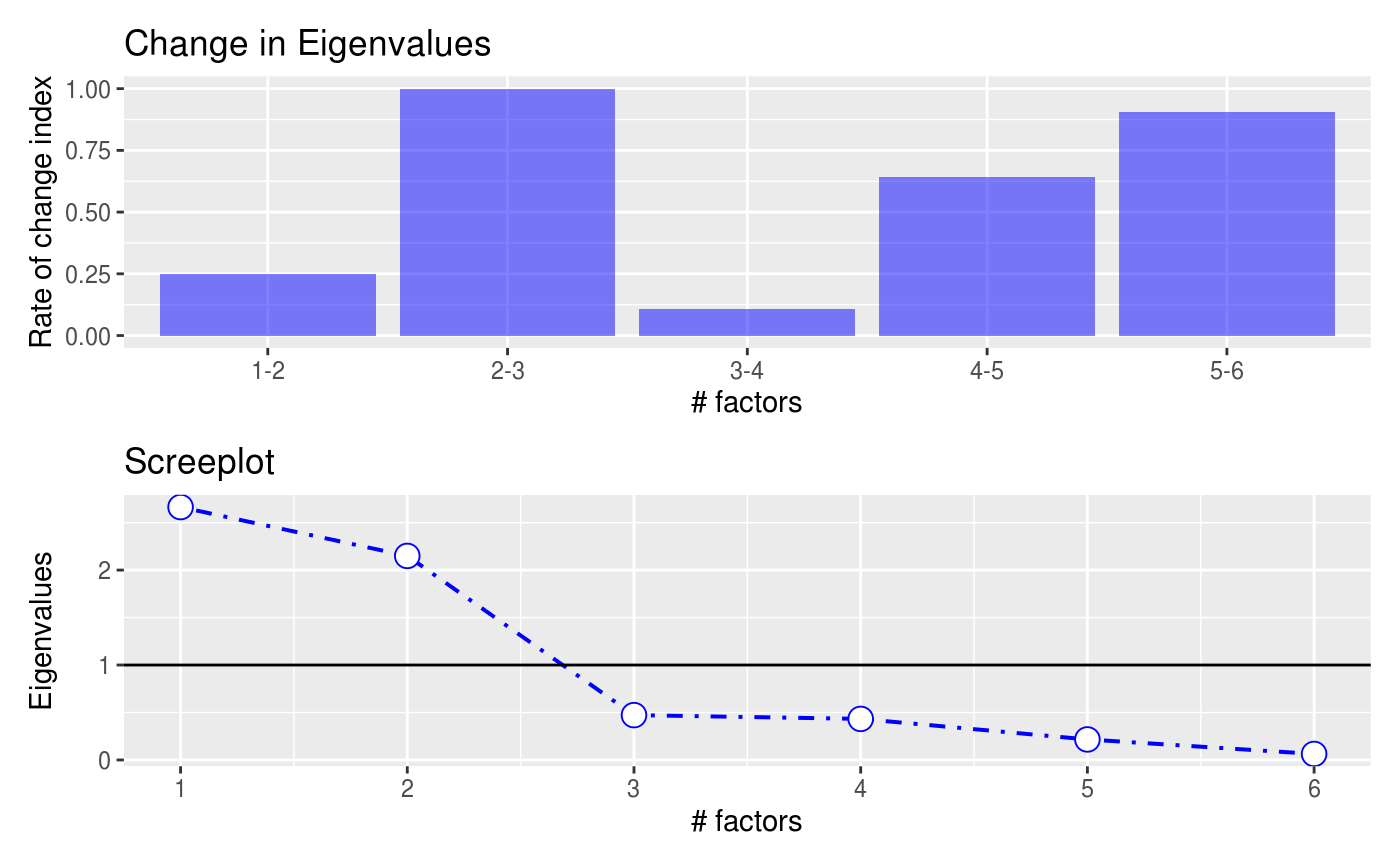
| plots | Plots to return. "change" shows the change in eigenvalues as variables are grouped into different number of factors, "scree" shows a scree plot of eigenvalues |
| cutoff | For large datasets plots can take time to render and become hard to interpret. By selection a cutoff point (e.g., eigenvalues of .8 or higher) factors with the least explanatory power are removed from the plot |
| shiny | Did the function call originate inside a shiny app |
| custom | Logical (TRUE, FALSE) to indicate if ggplot object (or list of ggplot objects) should be returned. This option can be used to customize plots (e.g., add a title, change x and y labels, etc.). See examples and http://docs.ggplot2.org for options. |
| ... | further arguments passed to or from other methods |
Details
See https://radiant-rstats.github.io/docs/multivariate/pre_factor.html for an example in Radiant
See also
pre_factor to calculate results
summary.pre_factor to summarize results