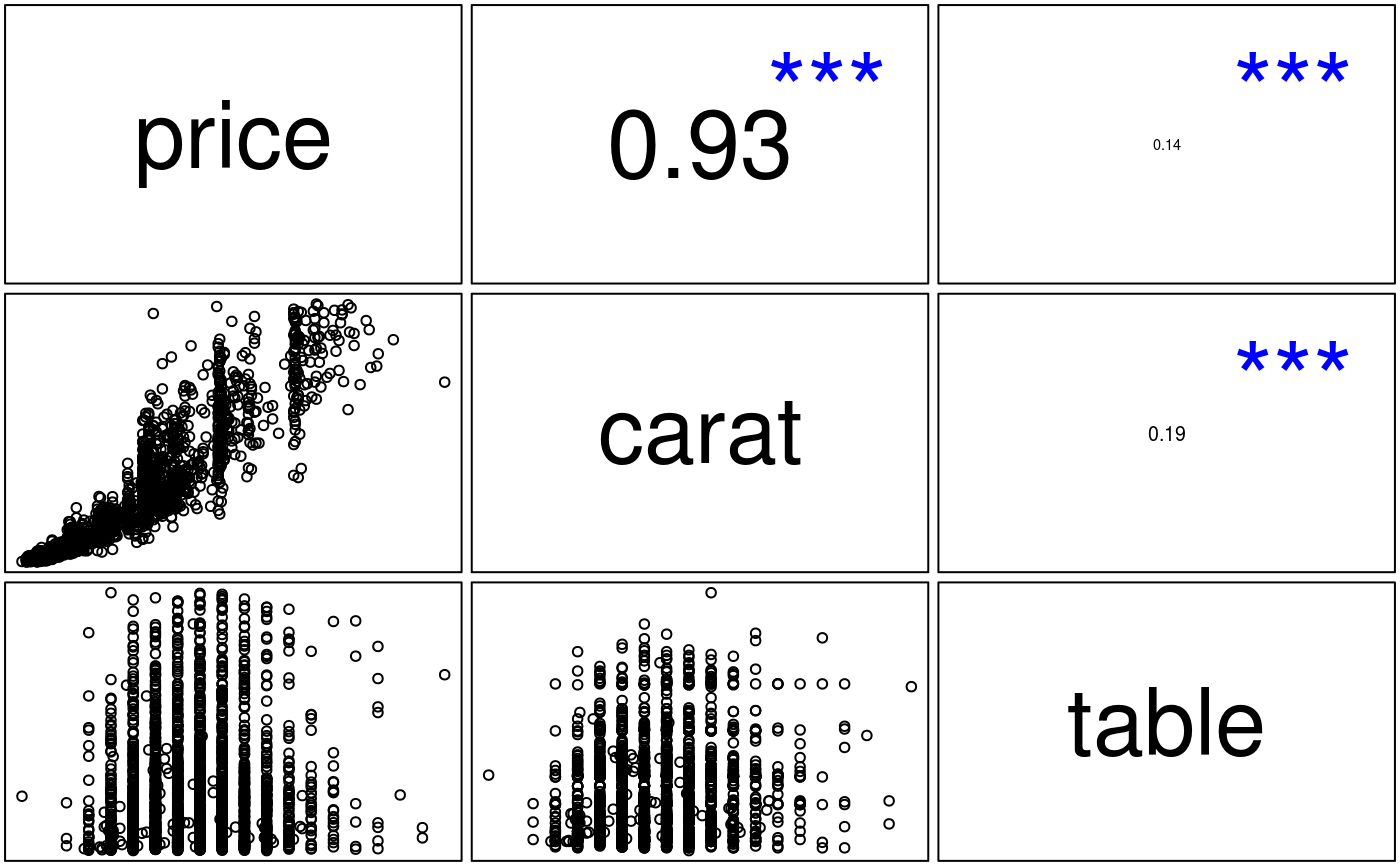
Plot method for the correlation function
# S3 method for correlation
plot(x, nrobs = -1, jit = c(0, 0), dec = 2, ...)
Arguments
| x | Return value from |
|---|---|
| nrobs | Number of data points to show in scatter plots (-1 for all) |
| jit | A numeric vector that determines the amount of jittering to apply to the x and y variables in a scatter plot. Default is 0. Use, e.g., 0.3 to add some jittering |
| dec | Number of decimals to show |
| ... | further arguments passed to or from other methods. |
Details
See https://radiant-rstats.github.io/docs/basics/correlation.html for an example in Radiant
See also
correlation to calculate results
summary.correlation to summarize results