Plot method for the regress function
# S3 method for regress
plot(
  x,
  plots = "",
  lines = "",
  conf_lev = 0.95,
  intercept = FALSE,
  nrobs = -1,
  shiny = FALSE,
  custom = FALSE,
  ...
)
Arguments
| x | Return value from |
|---|---|
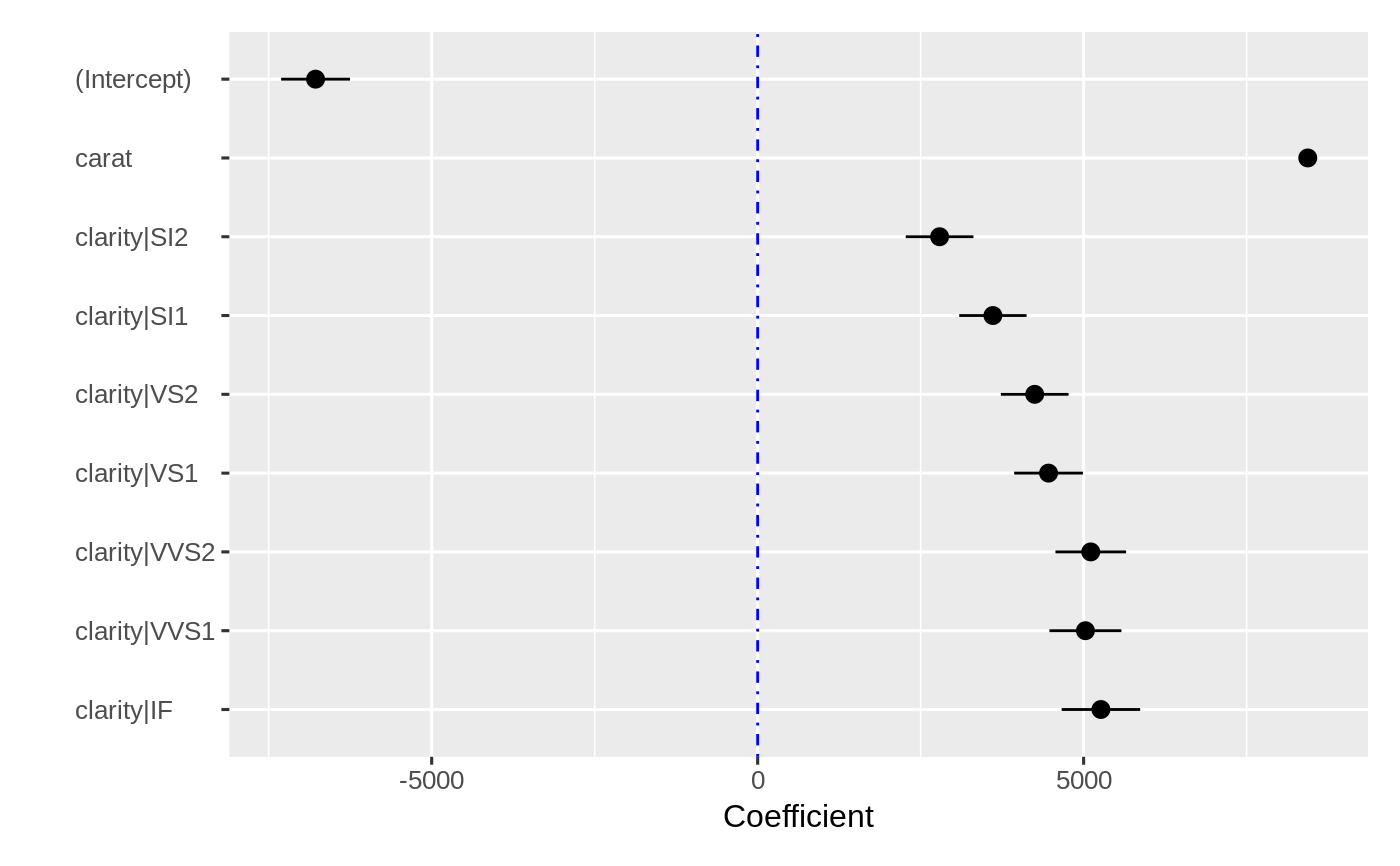
| plots | Regression plots to produce for the specified regression model. Enter "" to avoid showing any plots (default). "dist" to shows histograms (or frequency bar plots) of all variables in the model. "correlations" for a visual representation of the correlation matrix selected variables. "scatter" to show scatter plots (or box plots for factors) for the response variable with each explanatory variable. "dashboard" for a series of six plots that can be used to evaluate model fit visually. "resid_pred" to plot the explanatory variables against the model residuals. "coef" for a coefficient plot with adjustable confidence intervals and "influence" to show (potentially) influential observations |
| lines | Optional lines to include in the select plot. "line" to include a line through a scatter plot. "loess" to include a polynomial regression fit line. To include both use c("line", "loess") |
| conf_lev | Confidence level used to estimate confidence intervals (.95 is the default) |
| intercept | Include the intercept in the coefficient plot (TRUE, FALSE). FALSE is the default |
| nrobs | Number of data points to show in scatter plots (-1 for all) |
| shiny | Did the function call originate inside a shiny app |
| custom | Logical (TRUE, FALSE) to indicate if ggplot object (or list of ggplot objects) should be returned. This option can be used to customize plots (e.g., add a title, change x and y labels, etc.). See examples and https://ggplot2.tidyverse.org for options. |
| ... | further arguments passed to or from other methods |
Details
See https://radiant-rstats.github.io/docs/model/regress.html for an example in Radiant
See also
regress to generate the results
summary.regress to summarize results
predict.regress to generate predictions
Examples
result <- regress(diamonds, "price", c("carat", "clarity")) plot(result, plots = "coef", conf_lev = .99, intercept = TRUE)