Plot method for the confusion matrix
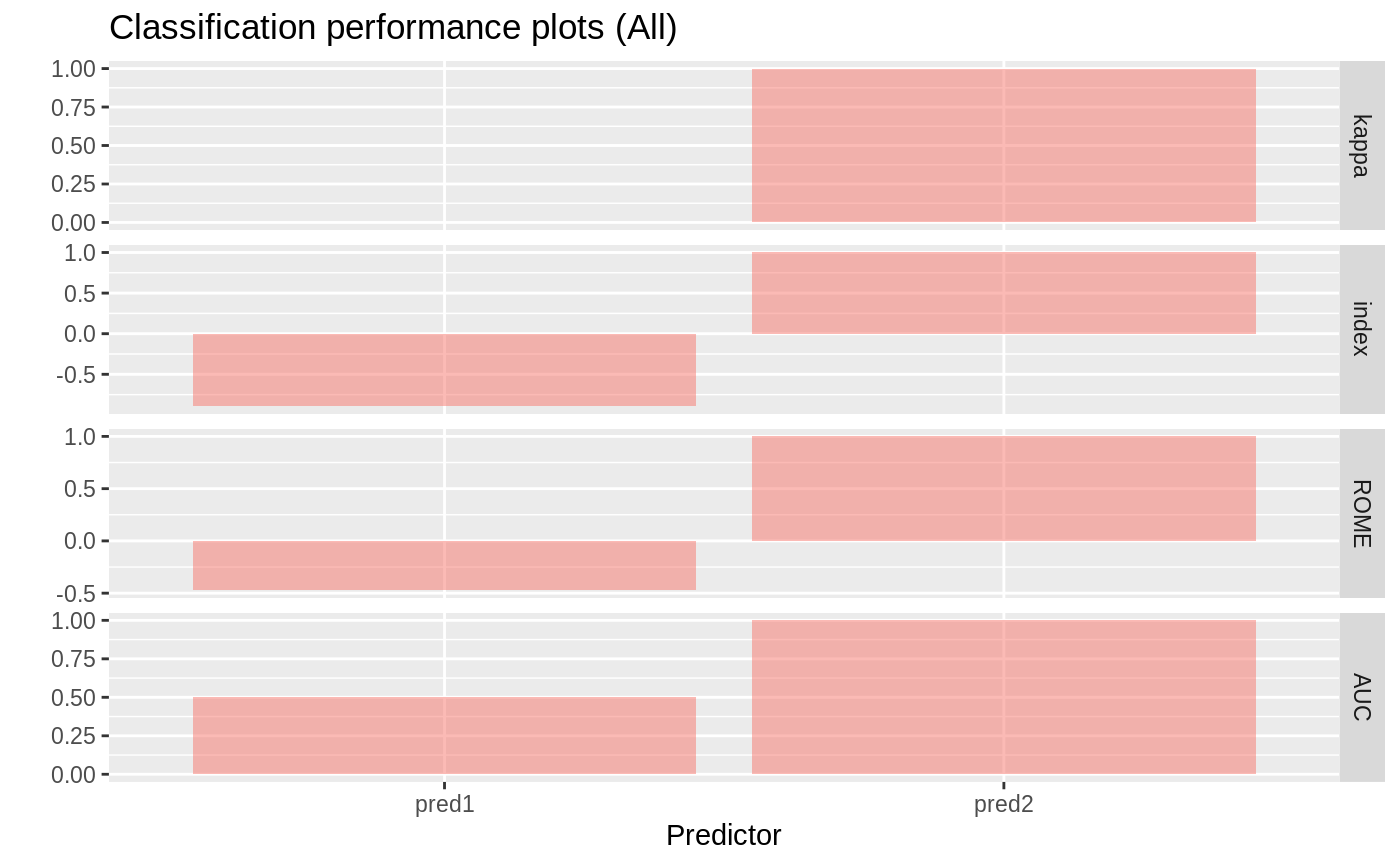
# S3 method for confusion
plot(
  x,
  vars = c("kappa", "index", "ROME", "AUC"),
  scale_y = TRUE,
  size = 13,
  ...
)
Arguments
| x | Return value from |
|---|---|
| vars | Measures to plot, i.e., one or more of "TP", "FP", "TN", "FN", "total", "TPR", "TNR", "precision", "accuracy", "kappa", "profit", "index", "ROME", "contact", "AUC" |
| scale_y | Free scale in faceted plot of the confusion matrix (TRUE or FALSE) |
| size | Font size used |
| ... | further arguments passed to or from other methods |
Details
See https://radiant-rstats.github.io/docs/model/evalbin.html for an example in Radiant
See also
confusion to generate results
summary.confusion to summarize results
Examples
data.frame(buy = dvd$buy, pred1 = runif(20000), pred2 = ifelse(dvd$buy == "yes", 1, 0)) %>%
  confusion(c("pred1", "pred2"), "buy") %>%
  plot()