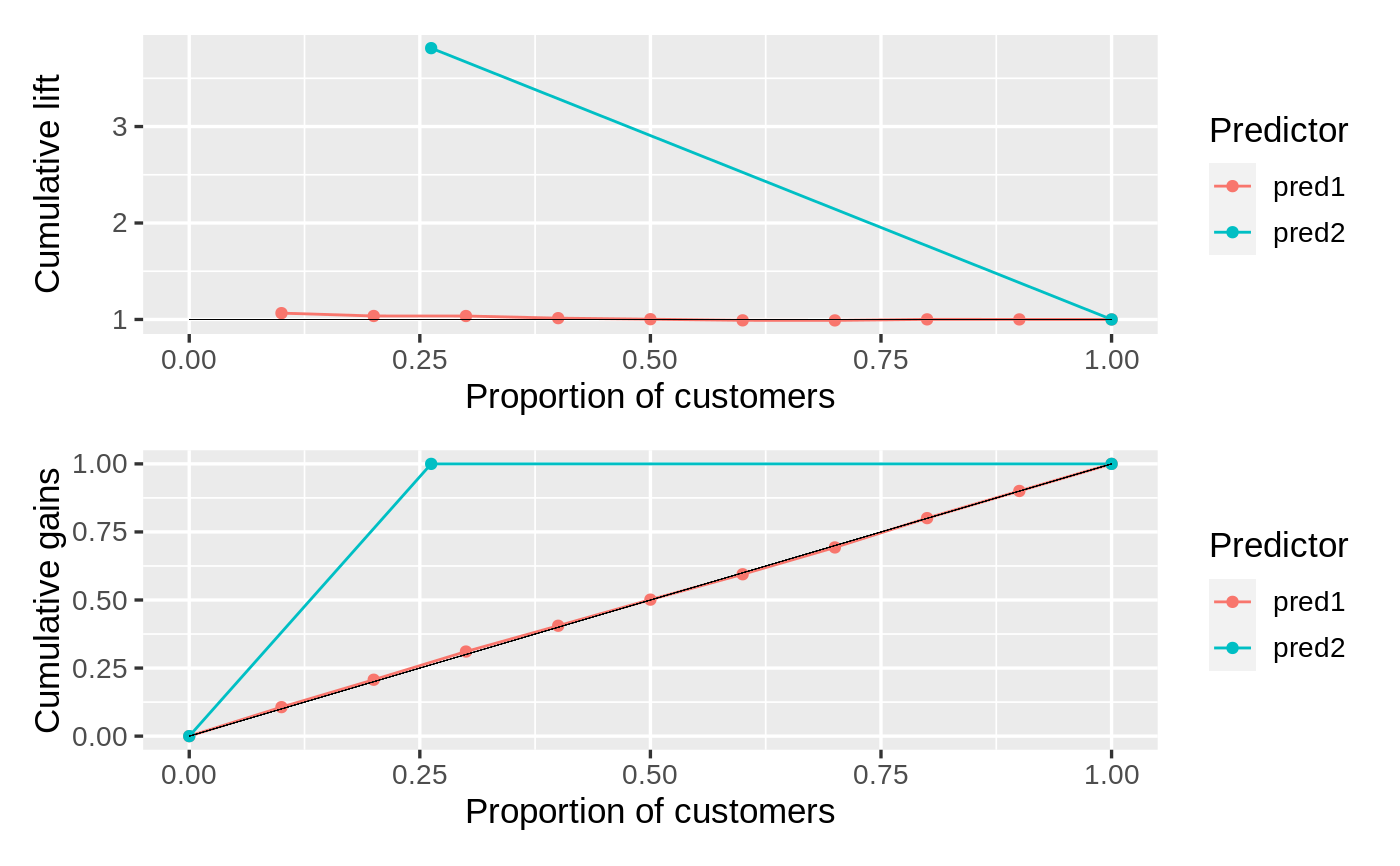
Plot method for the evalbin function
# S3 method for evalbin
plot(
  x,
  plots = c("lift", "gains"),
  size = 13,
  shiny = FALSE,
  custom = FALSE,
  ...
)
Arguments
| x | Return value from |
|---|---|
| plots | Plots to return |
| size | Font size used |
| shiny | Did the function call originate inside a shiny app |
| custom | Logical (TRUE, FALSE) to indicate if ggplot object (or list of ggplot objects) should be returned. This option can be used to customize plots (e.g., add a title, change x and y labels, etc.). See examples and https://ggplot2.tidyverse.org for options. |
| ... | further arguments passed to or from other methods |
Details
See https://radiant-rstats.github.io/docs/model/evalbin.html for an example in Radiant
See also
evalbin to generate results
summary.evalbin to summarize results
Examples
data.frame(buy = dvd$buy, pred1 = runif(20000), pred2 = ifelse(dvd$buy == "yes", 1, 0)) %>%
  evalbin(c("pred1", "pred2"), "buy") %>%
  plot()