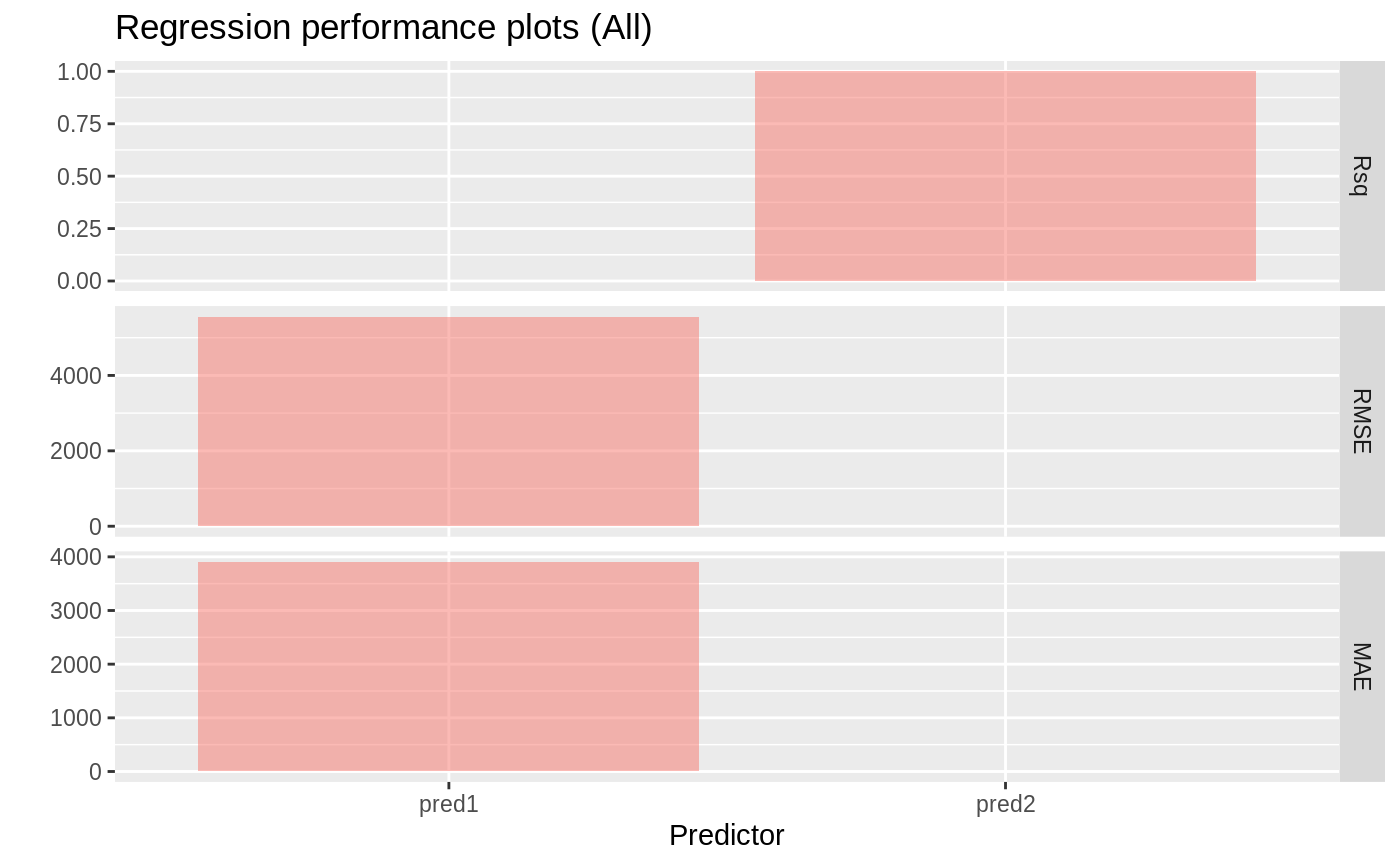
Plot method for the evalreg function
# S3 method for evalreg
plot(x, vars = c("Rsq", "RMSE", "MAE"), ...)
Arguments
| x | Return value from |
|---|---|
| vars | Measures to plot, i.e., one or more of "Rsq", "RMSE", "MAE" |
| ... | further arguments passed to or from other methods |
Details
See https://radiant-rstats.github.io/docs/model/evalreg.html for an example in Radiant
See also
evalreg to generate results
summary.evalreg to summarize results
Examples
data.frame(price = diamonds$price, pred1 = rnorm(3000), pred2 = diamonds$price) %>%
  evalreg(pred = c("pred1", "pred2"), "price") %>%
  plot()