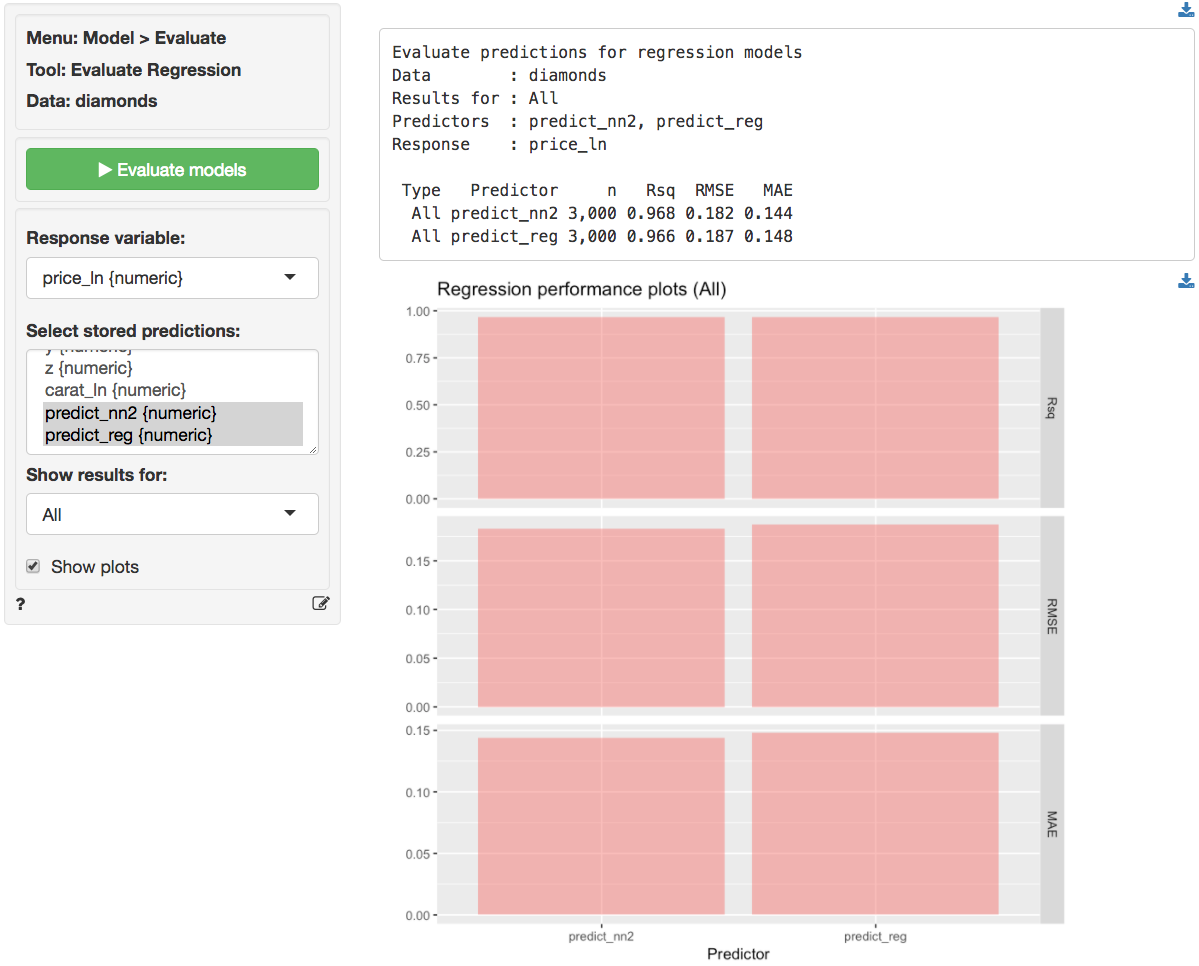
Model > Evaluate > Evaluate regression
Evaluate regression model performance
To download the table as a csv-files click the top download button on the right of your screen. To download the plots at a png file click the lower download icon on the right of your screen.
Response variable
The numeric outcome, or response, variable of interest.
Predictor
Select one or more variables that can be used to predict the value of the response variable. This could be a variable or predicted values from a model (e.g., from a regression estimated using Model > Linear regression (OLS) or a Neural Network estimated using Model > Neural Network).
Show results for
If a filter is active (e.g., set in the Data >
View tab) generate results for All data,
Training data, Test data, or Both
training and test data. If no filter is active calculations are applied
to all data.
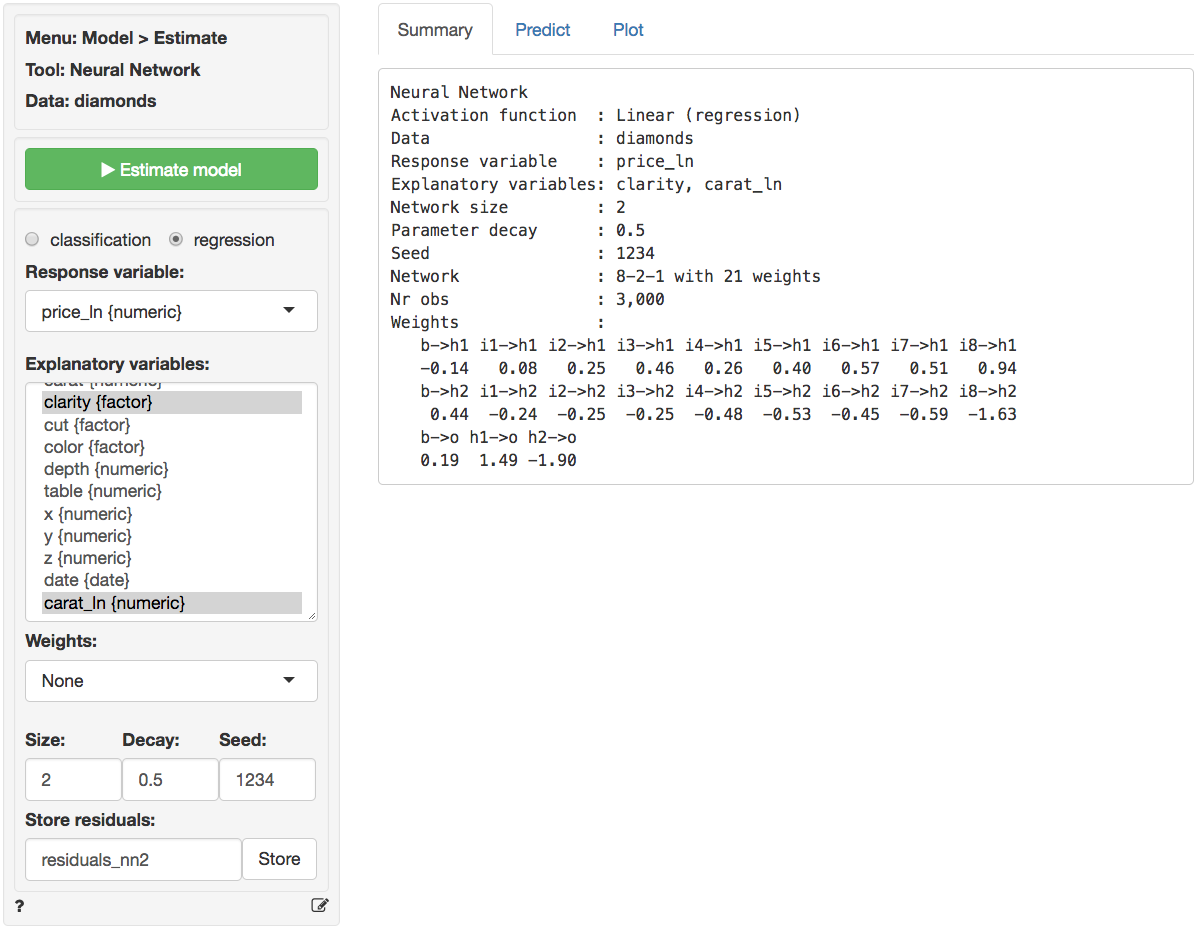
Example
Predictions were derived from a linear regression and an neural
network with two nodes in the hidden layer on the diamonds
data. The variables price and carat were
log-transformed prior to estimation.The data is available through the
Data > Manage tab (i.e., choose Examples from
the Load data of type drop-down and press
Load). The predictions shown below were generated in the
Predict tab.
The test statistics show a small, but consistent, advantage for the NN.
Report > Rmd
Add code to
Report
> Rmd to (re)create the analysis by clicking the
icon on the bottom
left of your screen or by pressing ALT-enter on your
keyboard.
Rsq, RSME, and MAE are plotted
by default. It is possible to customize the plotted results through
Report > Rmd. To change the plot use, for example:
The plot can be further customized using ggplot2
commands (see example below)). See
Data
> Visualize for details.
R-functions
For an overview of related R-functions used by Radiant to evaluate regression models see Model > Evaluate regression