Plot method for the logistic function
# S3 method for logistic
plot(
  x,
  plots = "coef",
  conf_lev = 0.95,
  intercept = FALSE,
  nrobs = -1,
  shiny = FALSE,
  custom = FALSE,
  ...
)
Arguments
| x | Return value from |
|---|---|
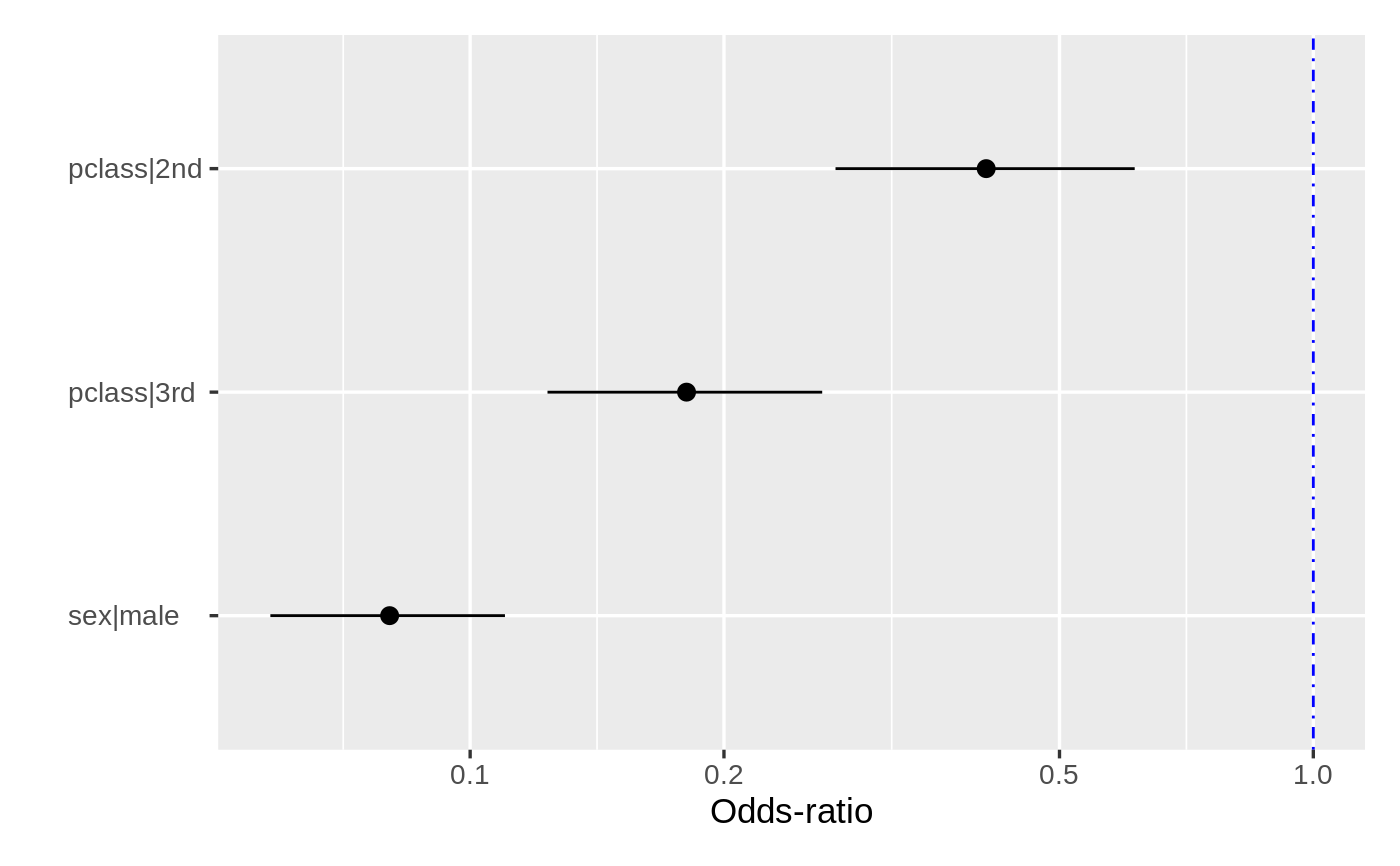
| plots | Plots to produce for the specified GLM model. Use "" to avoid showing any plots (default). "dist" shows histograms (or frequency bar plots) of all variables in the model. "scatter" shows scatter plots (or box plots for factors) for the response variable with each explanatory variable. "coef" provides a coefficient plot and "influence" shows (potentially) influential observations |
| conf_lev | Confidence level to use for coefficient and odds confidence intervals (.95 is the default) |
| intercept | Include the intercept in the coefficient plot (TRUE or FALSE). FALSE is the default |
| nrobs | Number of data points to show in scatter plots (-1 for all) |
| shiny | Did the function call originate inside a shiny app |
| custom | Logical (TRUE, FALSE) to indicate if ggplot object (or list of ggplot objects) should be returned. This option can be used to customize plots (e.g., add a title, change x and y labels, etc.). See examples and https://ggplot2.tidyverse.org for options. |
| ... | further arguments passed to or from other methods |
Details
See https://radiant-rstats.github.io/docs/model/logistic.html for an example in Radiant
See also
logistic to generate results
plot.logistic to plot results
predict.logistic to generate predictions
plot.model.predict to plot prediction output
Examples
result <- logistic(titanic, "survived", c("pclass", "sex"), lev = "Yes") plot(result, plots = "coef")#>