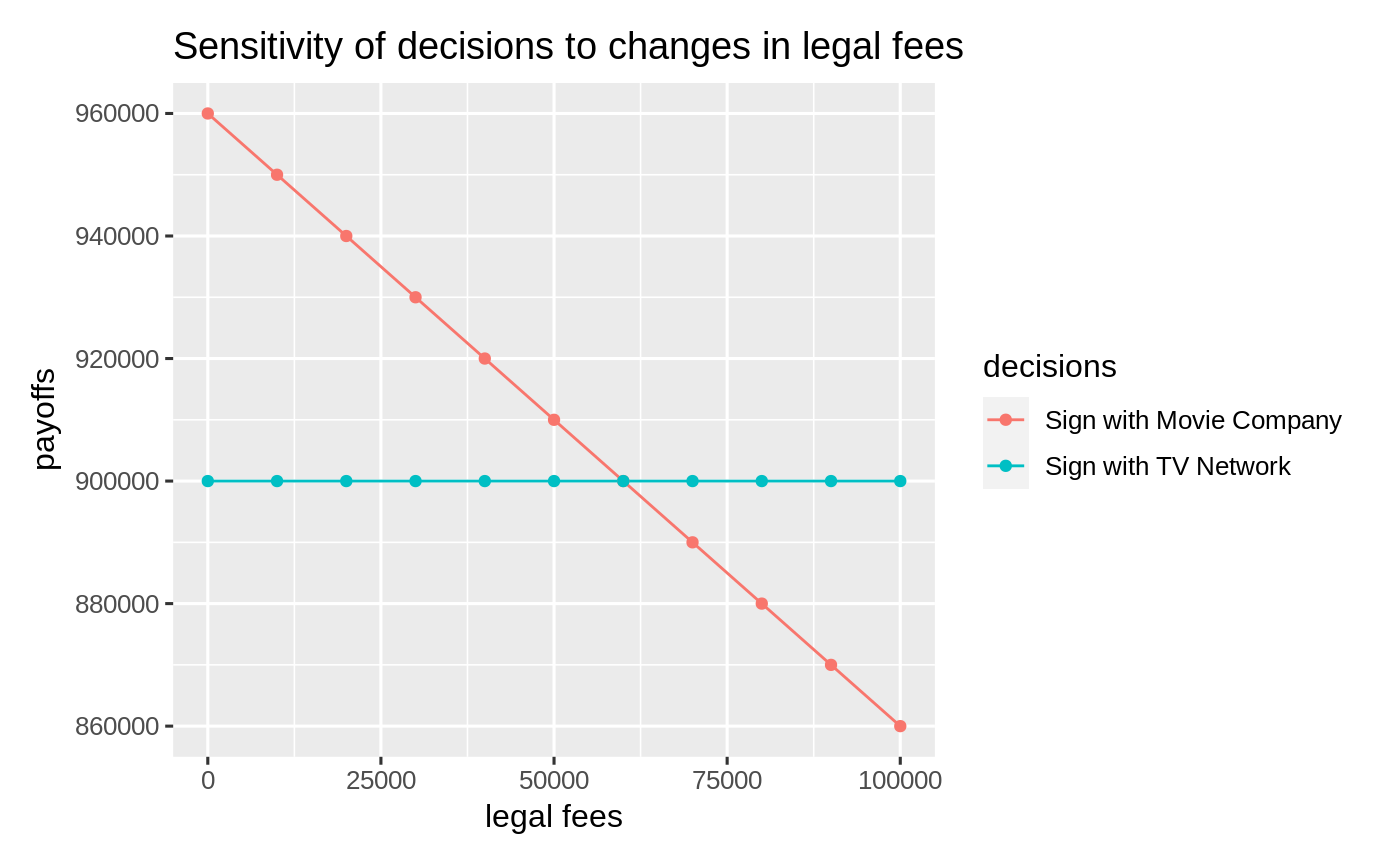
Evaluate sensitivity of the decision tree
# S3 method for dtree
sensitivity(
  object,
  vars = NULL,
  decs = NULL,
  envir = parent.frame(),
  shiny = FALSE,
  custom = FALSE,
  ...
)
Arguments
| object | Return value from |
|---|---|
| vars | Variables to include in the sensitivity analysis |
| decs | Decisions to include in the sensitivity analysis |
| envir | Environment to extract data from |
| shiny | Did the function call originate inside a shiny app |
| custom | Logical (TRUE, FALSE) to indicate if ggplot object (or list of ggplot objects) should be returned. This option can be used to customize plots (e.g., add a title, change x and y labels, etc.). See examples and https://ggplot2.tidyverse.org for options. |
| ... | Additional arguments |
Details
See https://radiant-rstats.github.io/docs/model/dtree.html for an example in Radiant
See also
dtree to generate the result
plot.dtree to summarize results
summary.dtree to summarize results
Examples
dtree(movie_contract, opt = "max") %>%
  sensitivity(
    vars = "legal fees 0 100000 10000",
    decs = c("Sign with Movie Company", "Sign with TV Network"),
    custom = FALSE
  )